Apollo Global Management Investor Presentation Deck
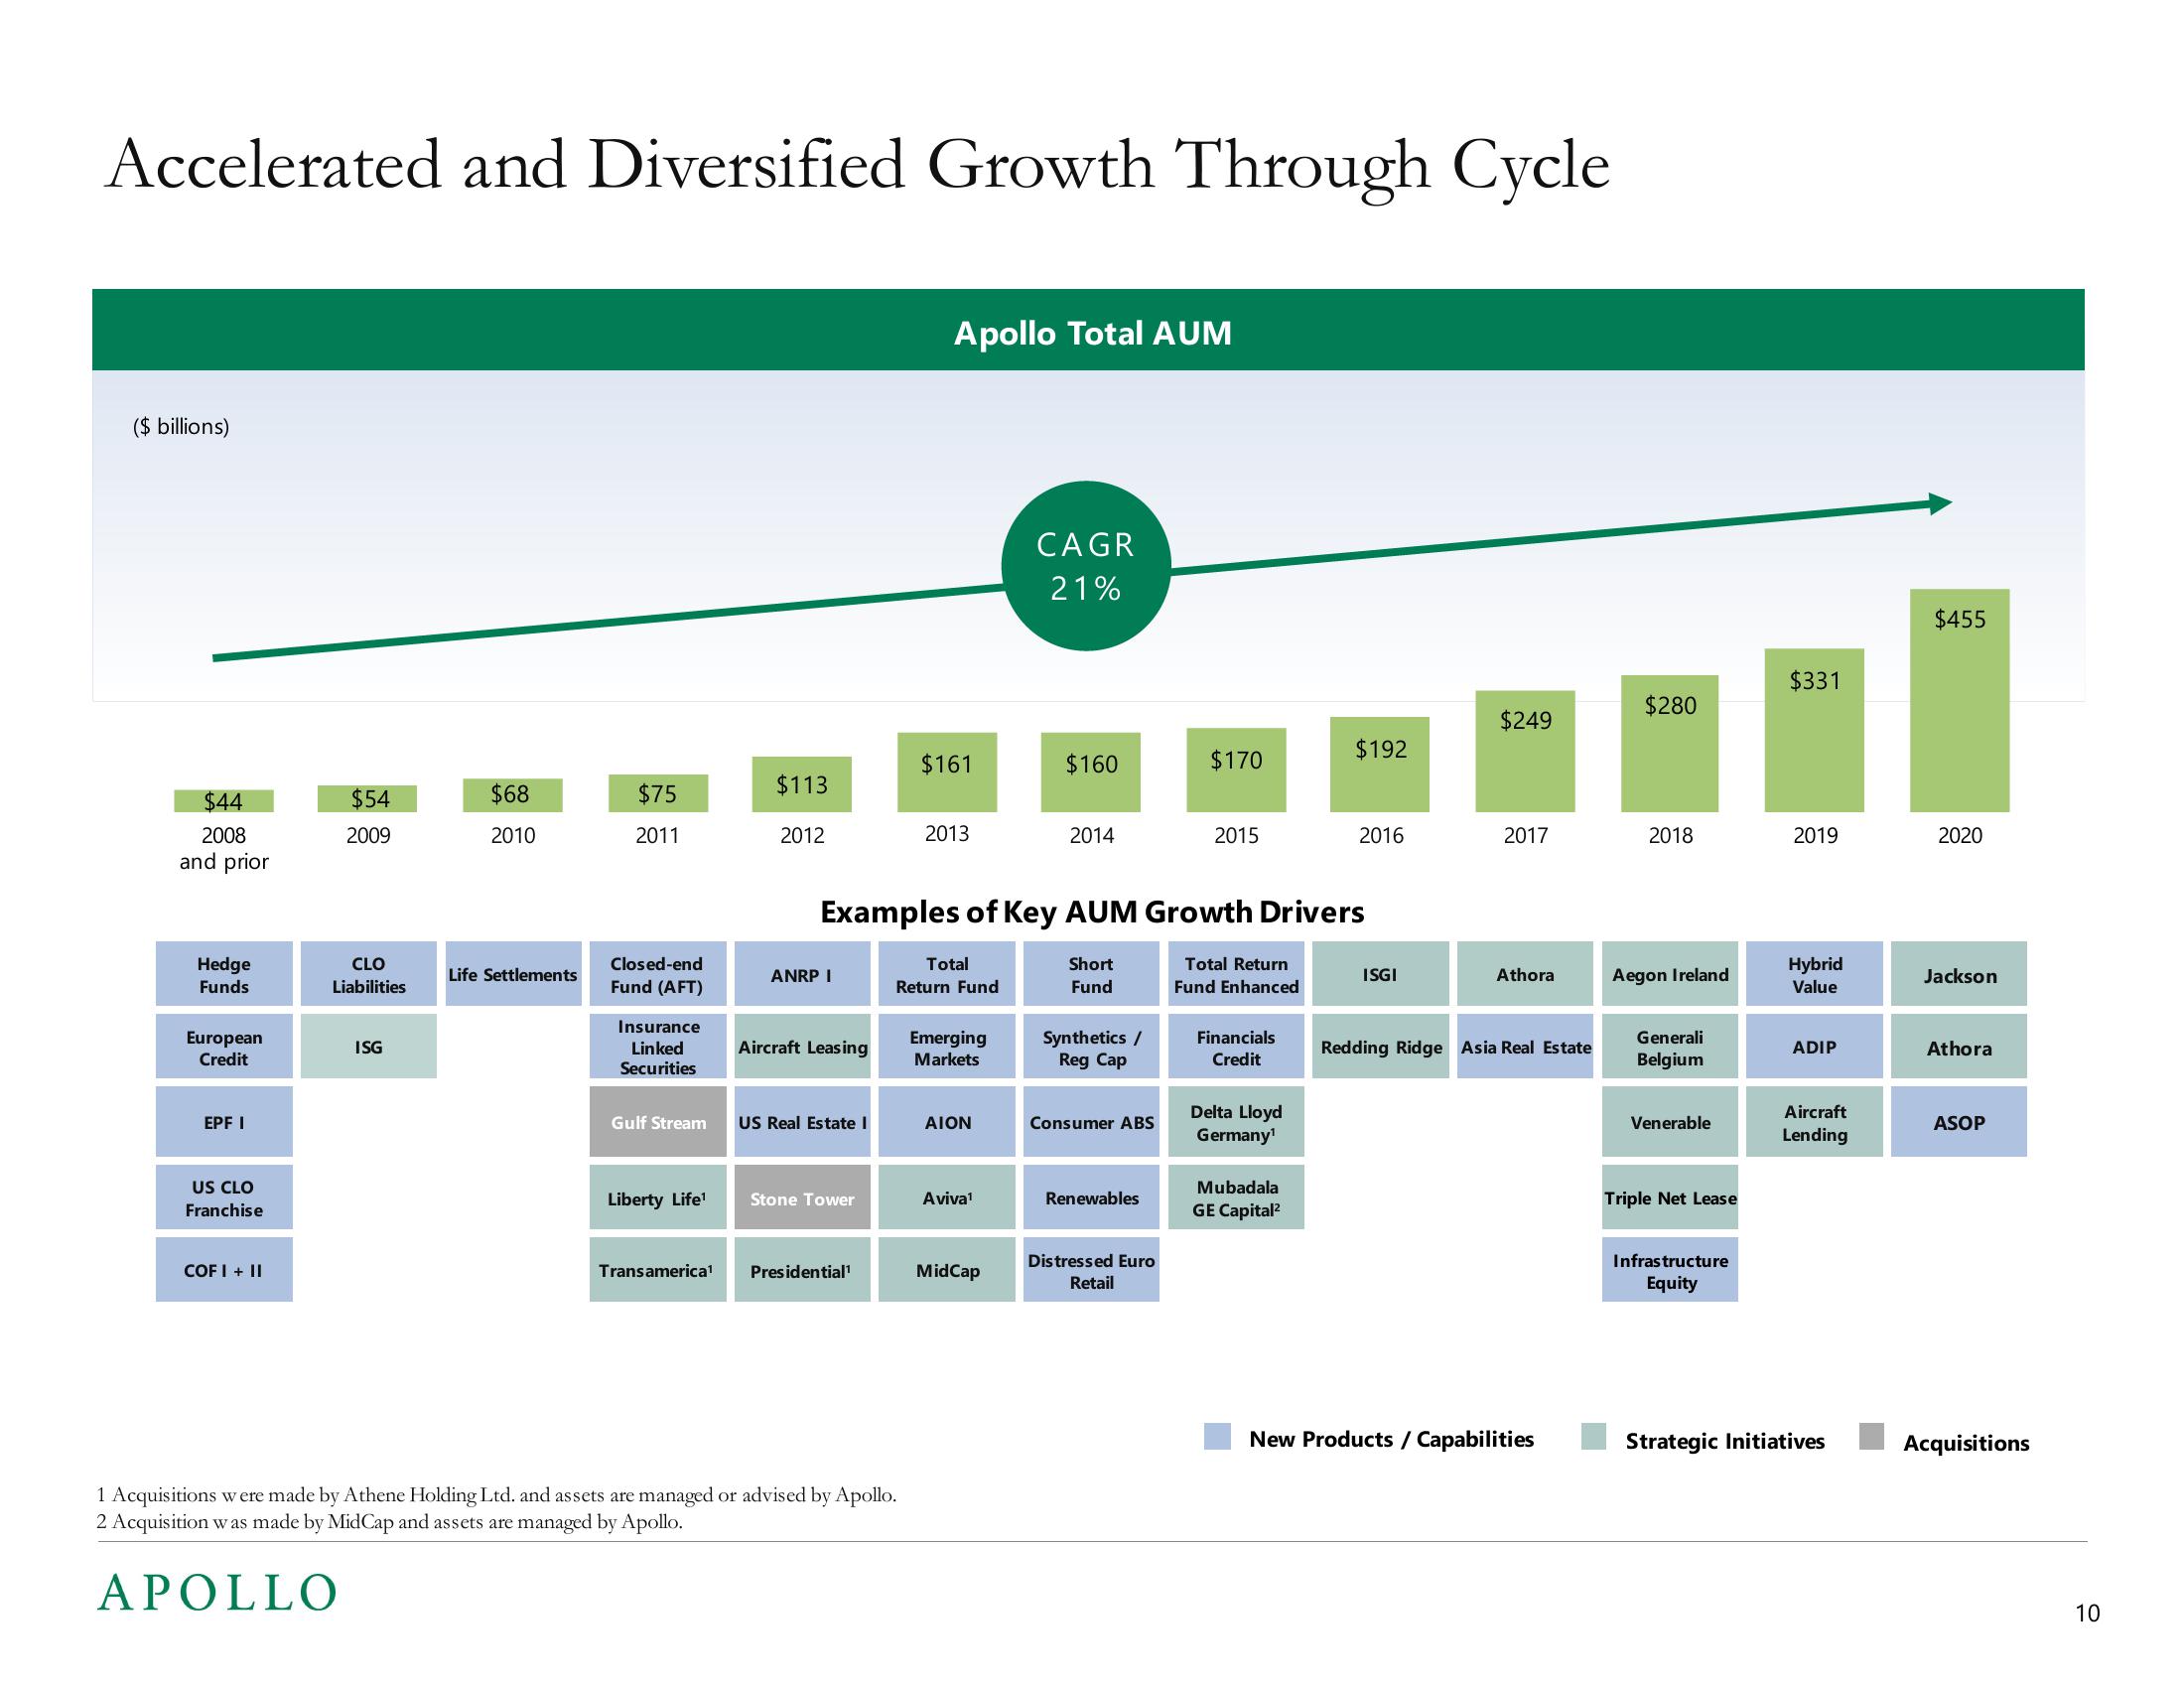
Accelerated and Diversified Growth Through Cycle
($ billions)
$44
2008
and prior
Hedge
Funds
European
Credit
EPF I
US CLO
Franchise
COF I + II
$54
2009
APOLLO
CLO
Liabilities
ISG
$68
2010
Life Settlements
$75
2011
Closed-end
Fund (AFT)
Insurance
Linked
Securities
Gulf Stream
Liberty Life¹
$113
2012
ANRP I
Aircraft Leasing
US Real Estate I
Stone Tower
Transamerica1¹ Presidential¹
Apollo Total AUM
1 Acquisitions were made by Athene Holding Ltd. and assets are managed or advised by Apollo.
2 Acquisition was made by MidCap and assets are managed by Apollo.
$161
2013
Total
Return Fund
Examples of Key AUM Growth Drivers
Short
Fund
Total Return
Fund Enhanced
Emerging
Markets
AION
Aviva¹
CAGR
21%
MidCap
$160
2014
Synthetics /
Reg Cap
Consumer ABS
Renewables
$170
Distressed Euro
Retail
2015
Financials
Credit
Delta Lloyd
Germany¹
$192
Mubadala
GE Capital²
2016
ISGI
$249
2017
Athora
Redding Ridge Asia Real Estate
New Products / Capabilities
$280
2018
Aegon Ireland
Generali
Belgium
Venerable
Triple Net Lease
Infrastructure
Equity
$331
2019
Hybrid
Value
ADIP
Aircraft
Lending
Strategic Initiatives
$455
2020
Jackson
Athora
ASOP
Acquisitions
10View entire presentation