Inovalon Results Presentation Deck
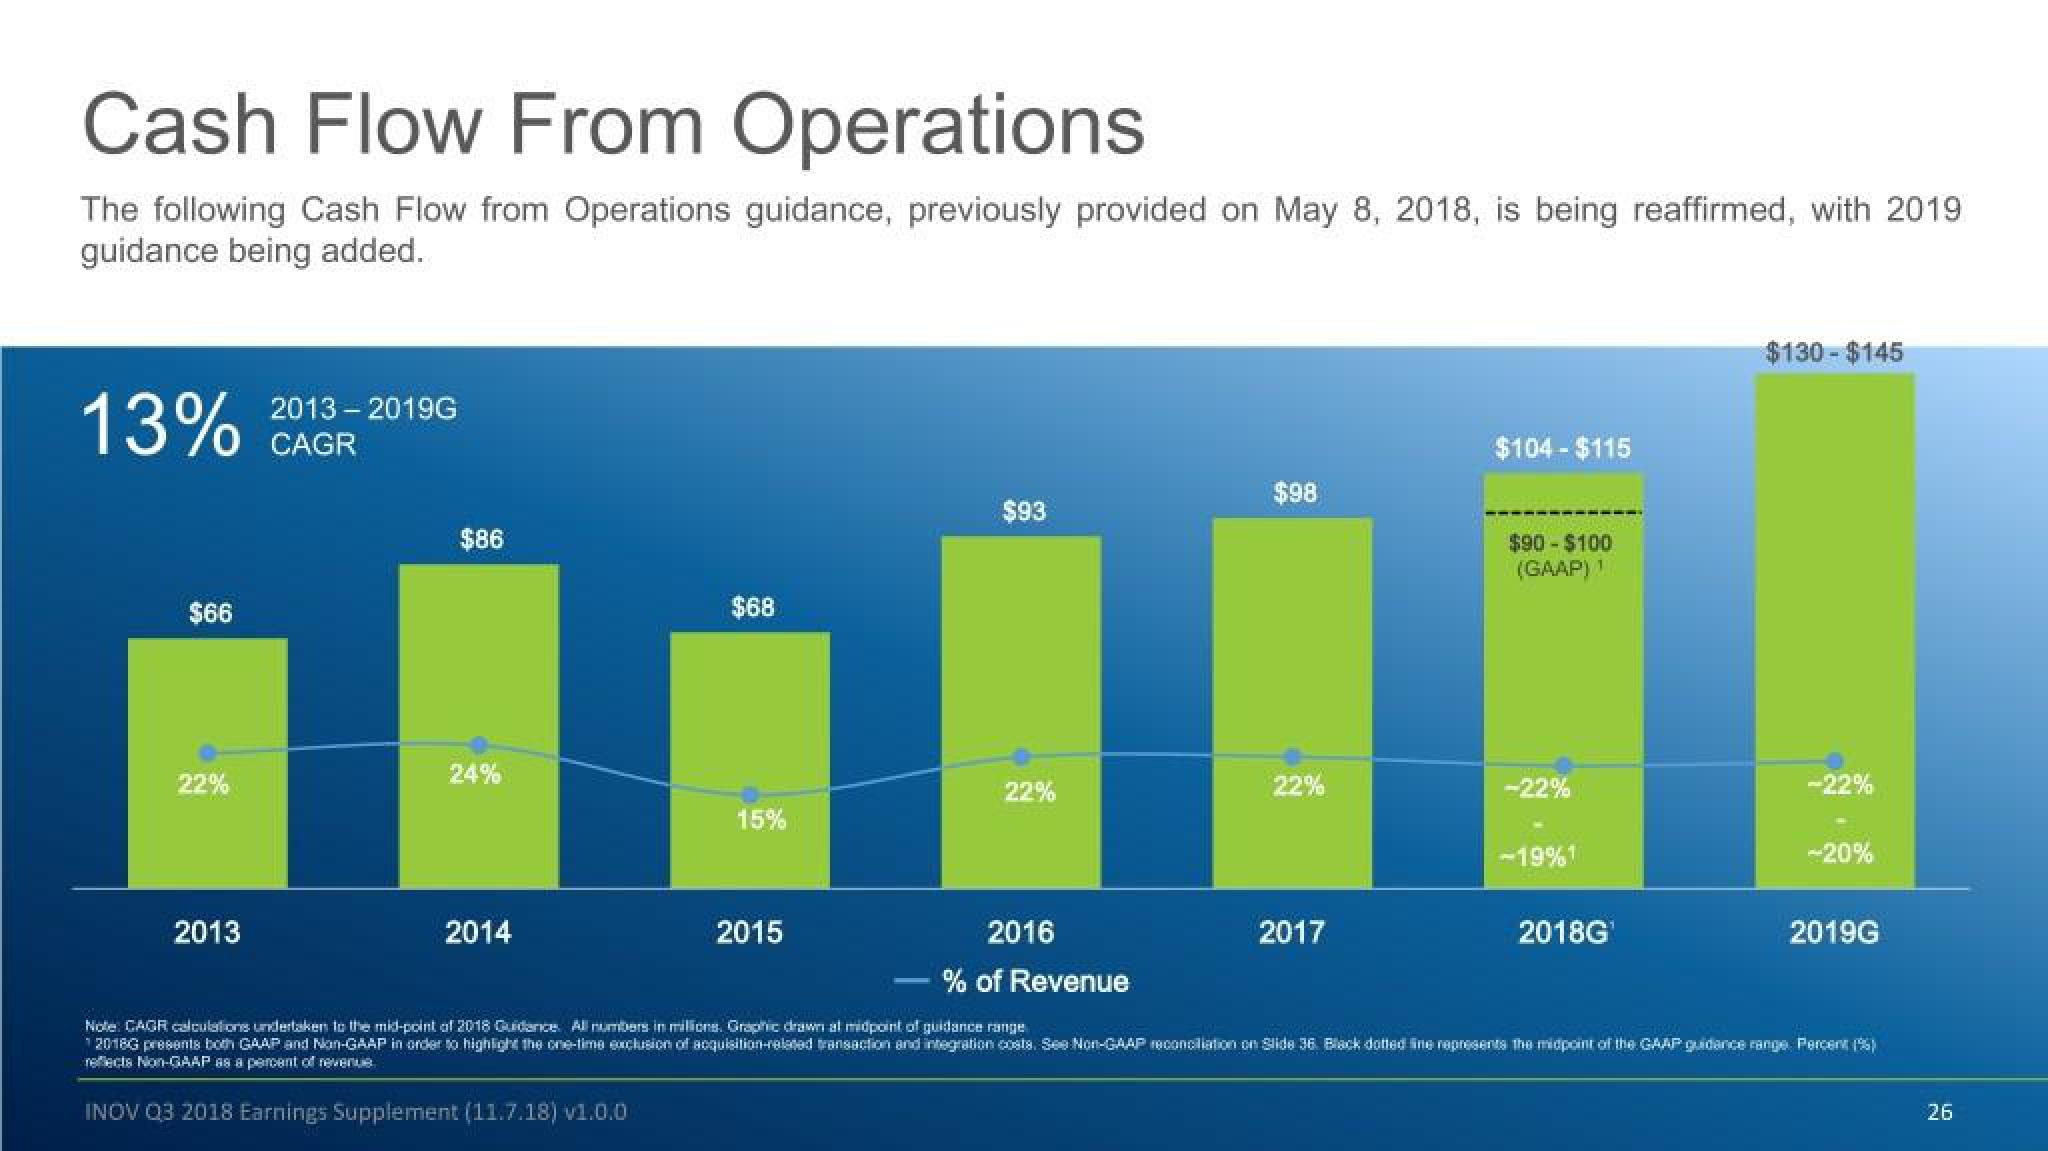
Cash Flow From Operations
The following Cash Flow from Operations guidance, previously provided on May 8, 2018, is being reaffirmed, with 2019
guidance being added.
13%
$66
22%
2013
2013-2019G
CAGR
$86
24%
2014
$68
15%
2015
$93
22%
$98
22%
2017
$104 - $115
$90 - $100
(GAAP) 1
-22%
-19% 11
2018G¹
$130-$145
-22%
-20%
2019G
2016
% of Revenue
Note: CAGR calculations undertaken to the mid-point of 2018 Guidance. All numbers in millions. Graphic drawn al midpoint of guidance range
2018G presents both GAAP and Non-GAAP in order to highlight the one-time exclusion of acquisition-related transaction and integration costs. See Non-GAAP reconciliation on Slide 36. Black dotted line represents The midpoint of the GAAP guidance range. Percent (%)
reflects Non-GAAP as a percent of revenue
INOV Q3 2018 Earnings Supplement (11.7.18) v1.0.0
26View entire presentation