J.P.Morgan Investment Banking Pitch Book
APPENDIX
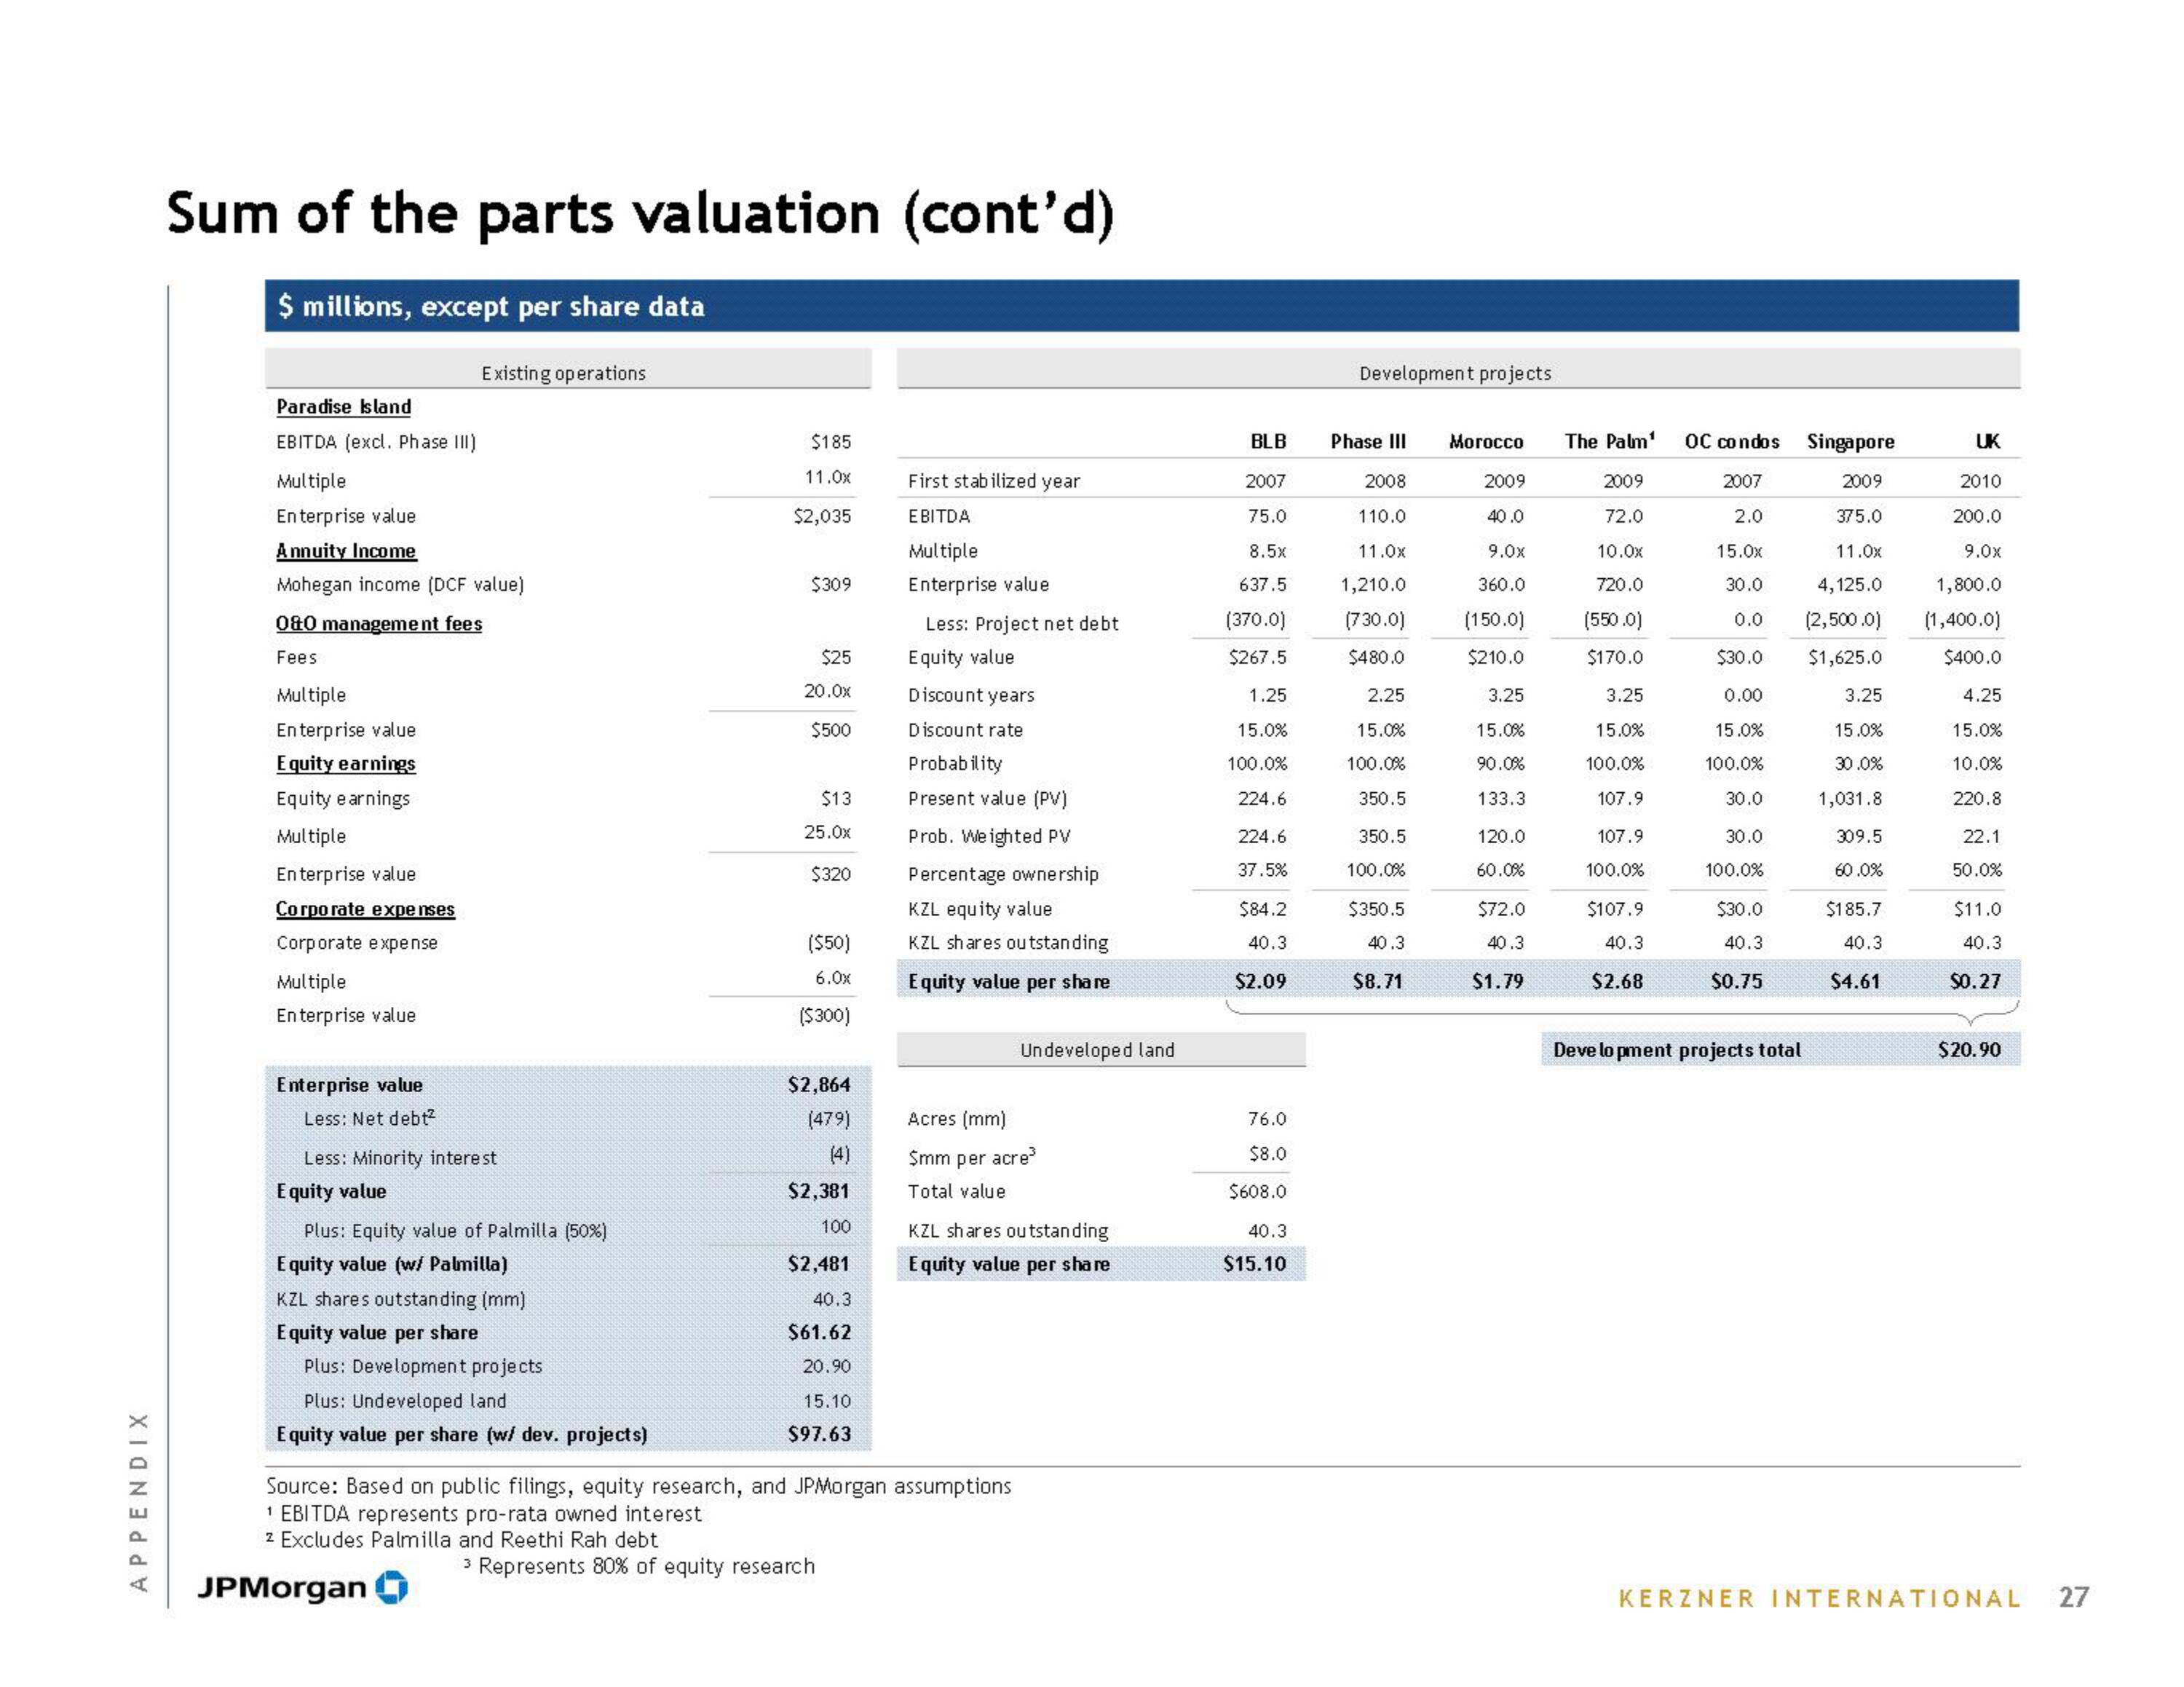
Sum of the parts valuation (cont'd)
$ millions, except per share data
Paradise Island
EBITDA (excl. Phase III)
Multiple
Enterprise value
Annuity Income
Mohegan income (DCF value)
080 management fees
Fees
Multiple
Enterprise value
Equity earnings
Equity earnings
Multiple
Enterprise value
Corporate expenses
Corporate expense
Multiple
Enterprise value
Existing operations
Enterprise value
Less: Net debt²
Less: Minority interest
Equity value
Plus: Equity value of Palmilla (50%)
Equity value (w/ Palmilla)
KZL shares outstanding (mm)
Equity value per share
Plus: Development projects
Plus: Undeveloped land
Equity value per share (w/ dev. projects)
JPMorgan
$185
11.0x
$2,035
$309
$25
20.0x
$500
$13
25.0x
$320
($50)
6.0x
($300)
$2,864
(479)
(4)
$2,381
100
$2,481
40.3
$61.62
20.90
15.10
$97.63
First stabilized year
EBITDA
Multiple
Enterprise value
3 Represents 80% of equity research
Less: Project net debt
Equity value
Discount years
Discount rate
Probability
Present value (PV)
Prob. Weighted PV
Percentage ownership
KZL equity value
KZL shares outstanding
Equity value per share
Source: Based on public filings, equity research, and JPMorgan assumptions
¹ EBITDA represents pro-rata owned interest
2 Excludes Palmilla and Reethi Rah debt
Undeveloped land
Acres (mm)
$mm per acre
Total value
KZL shares outstanding
Equity value per share
BLB
2007
75.0
8.5x
637.5
(370.0)
$267.5
1.25
15.0%
100.0%
224.6
224.6
37.5%
$84.2
40.3
$2.09
76.0
$8.0
$608.0
40.3
$15.10
Development projects
Phase III
2008
110.0
11.0x
1,210.0
(730.0)
$480.0
2.25
15.0%
100.0%
350.5
350.5
100.0%
$350.5
40.3
$8.71
Morocco
2009
40.0
9.0x
360.0
(150.0)
$210.0
3.25
15.0%
90.0%
133.3
120.0
60.0%
$72.0
40.3
$1.79
The Palm¹
2009
72.0
10.0x
720.0
(550.0)
$170.0
3.25
15.0%
100.0%
107.9
107.9
100.0%
$107.9
40.3
$2.68
OC condos Singapore
2007
2009
2.0
375.0
15.0x
11.0x
30.0
4,125.0
0.0 (2,500.0)
$30.0 $1,625.0
0.00
3.25
15.0%
15.0%
100.0%
30.0%
30.0 1,031.8
30.0
100.0%
$30.0
40.3
309.5
60.0%
$0.75
Development projects total
$185.7
40.3
$4.61
UK
2010
200.0
9.0x
1,800.0
(1,400.0)
$400.0
4.25
15.0%
10.0%
220.8
22.1
50.0%
$11.0
40.3
$0.27
$20.90
KERZNER INTERNATIONAL
27View entire presentation