Silicon Valley Bank Results Presentation Deck
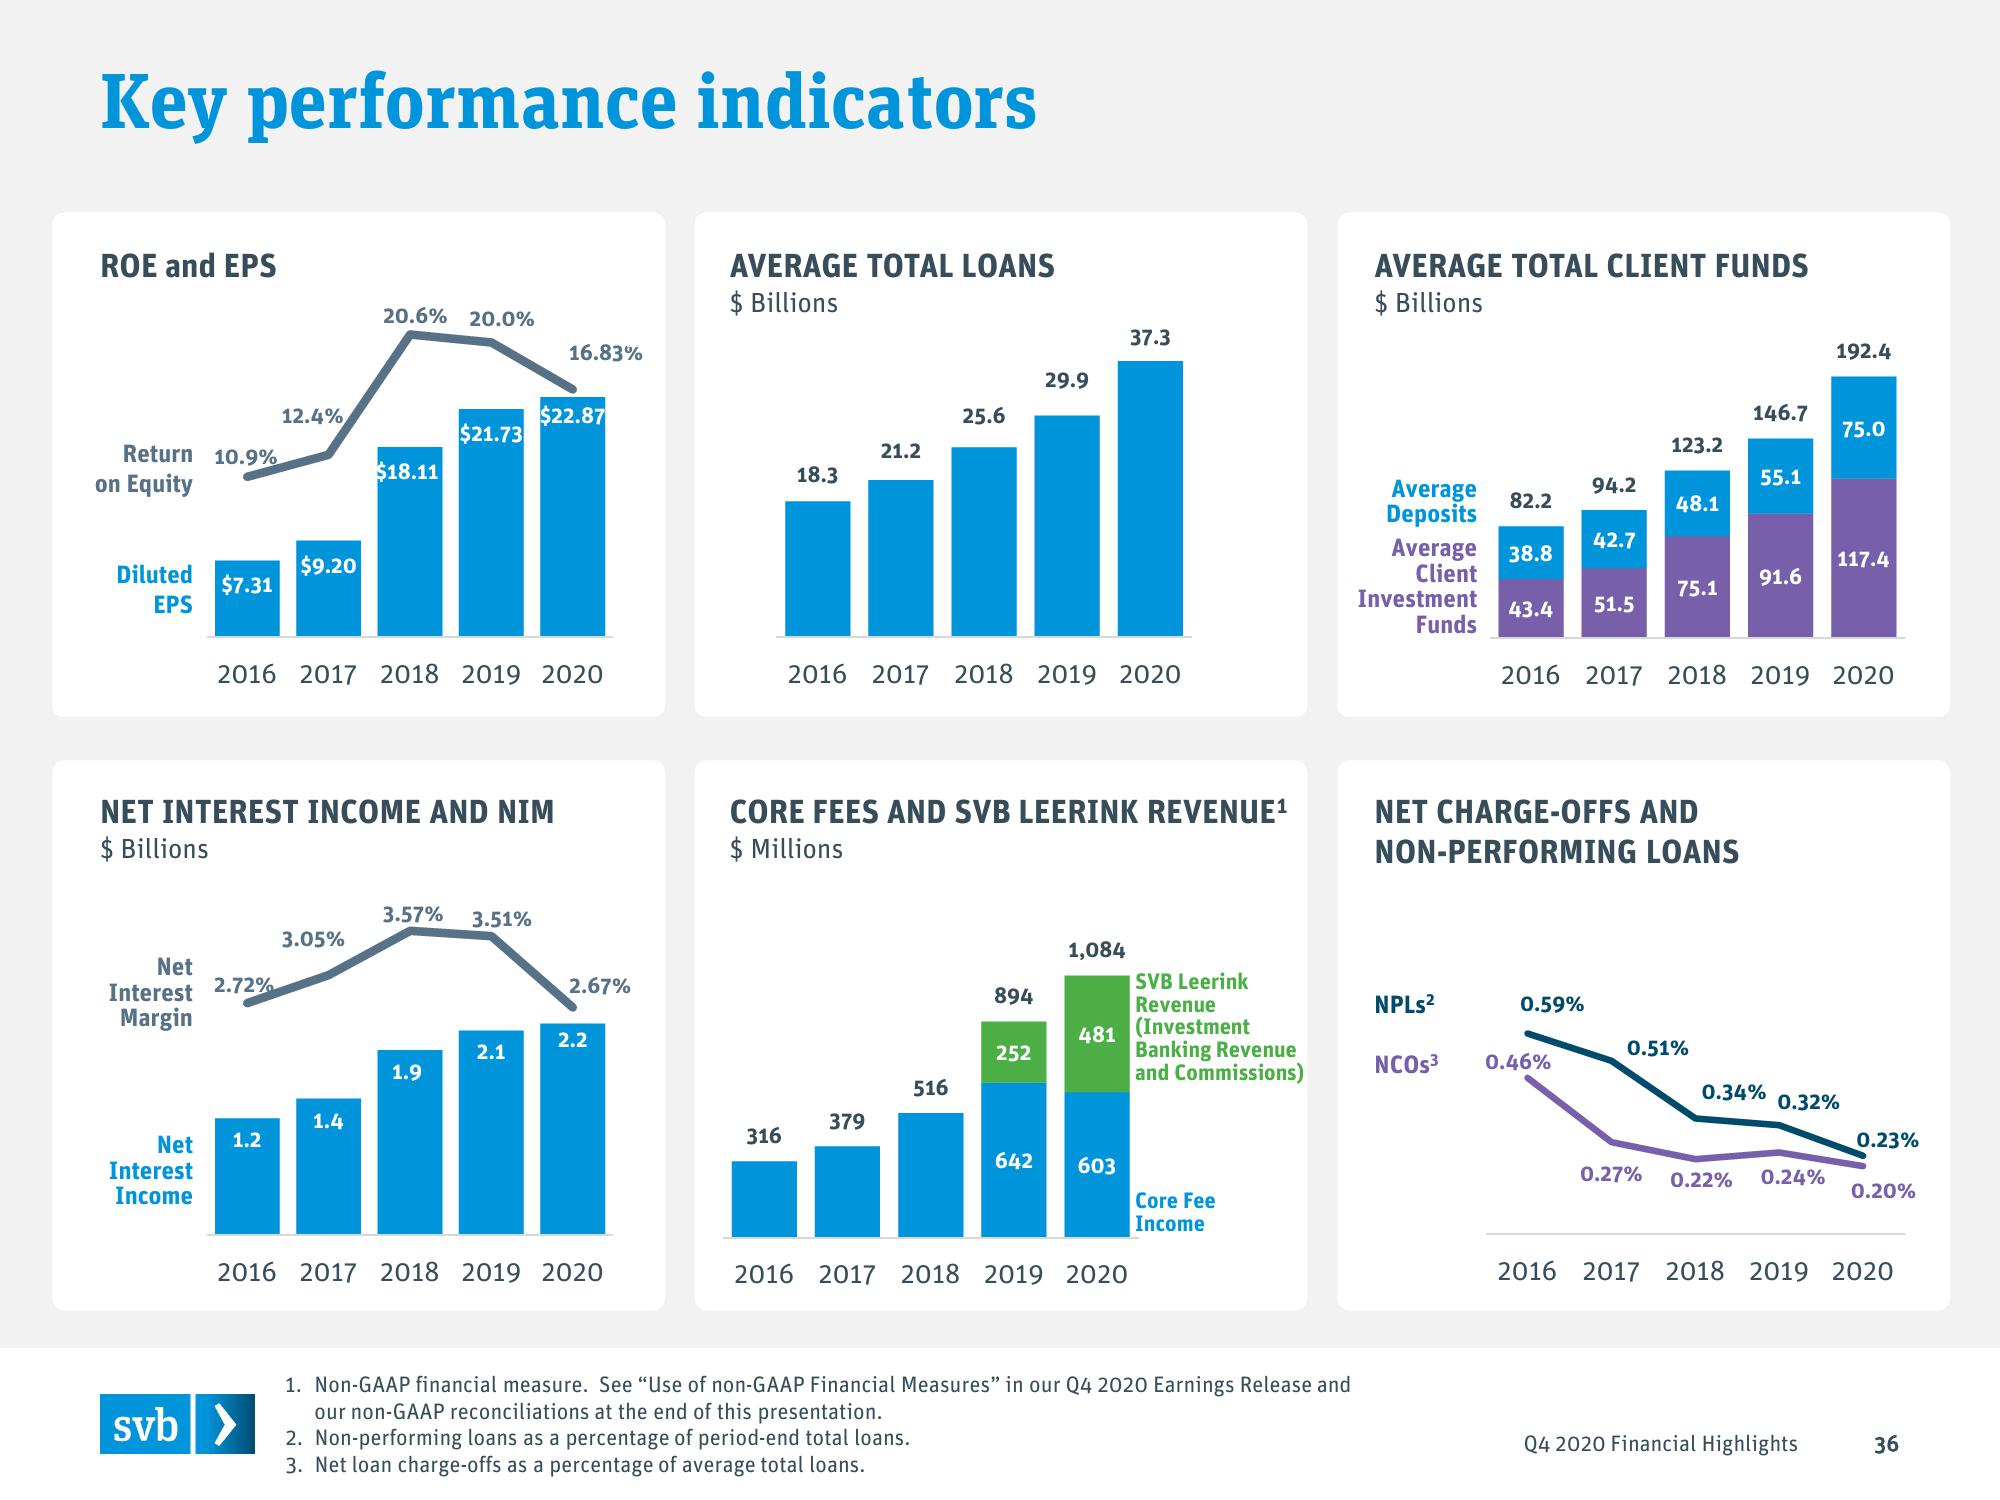
Key performance indicators
ROE and EPS
Return 10.9%
on Equity
Diluted
EPS
Net
Interest
Margin
$7.31
Interest
Income
2.72%
Net 1.2
12.4%
$9.20
NET INTEREST INCOME AND NIM
$ Billions
svb >
20.6% 20.0%
2016 2017 2018 2019 2020
3.05%
$18.11
1.4
$21.73
3.57% 3.51%
1.9
16.83%
$22.87
2.1
2.67%
2.2
2016 2017 2018 2019 2020
AVERAGE TOTAL LOANS
$ Billions
18.3
316
21.2
379
25.6
2016 2017 2018 2019 2020
CORE FEES AND SVB LEERINK REVENUE¹
$ Millions
516
894
29.9
252
642
1,084
481
37.3
603
2016 2017 2018 2019 2020
SVB Leerink
Revenue
(Investment
Banking Revenue
and Commissions)
Core Fee
Income
1. Non-GAAP financial measure. See "Use of non-GAAP Financial Measures" in our Q4 2020 Earnings Release and
our non-GAAP reconciliations at the end of this presentation.
2. Non-performing loans as a percentage of period-end total loans.
3. Net loan charge-offs as a percentage of average total loans.
AVERAGE TOTAL CLIENT FUNDS
$ Billions
Average
Deposits
Average 38.8
Client
Investment
Funds
NPLs²
82.2
NCOs³
94.2
43.4 51.5
42.7
0.59%
0.46%
123.2
NET CHARGE-OFFS AND
NON-PERFORMING LOANS
48.1
75.1
146.7
0.51%
55.1
91.6
2016 2017 2018 2019 2020
192.4
0.27% 0.22% 0.24%
0.34% 0.32%
75.0
117.4
Q4 2020 Financial Highlights
0.23%
0.20%
2016 2017 2018 2019 2020
36View entire presentation