Lyft Results Presentation Deck
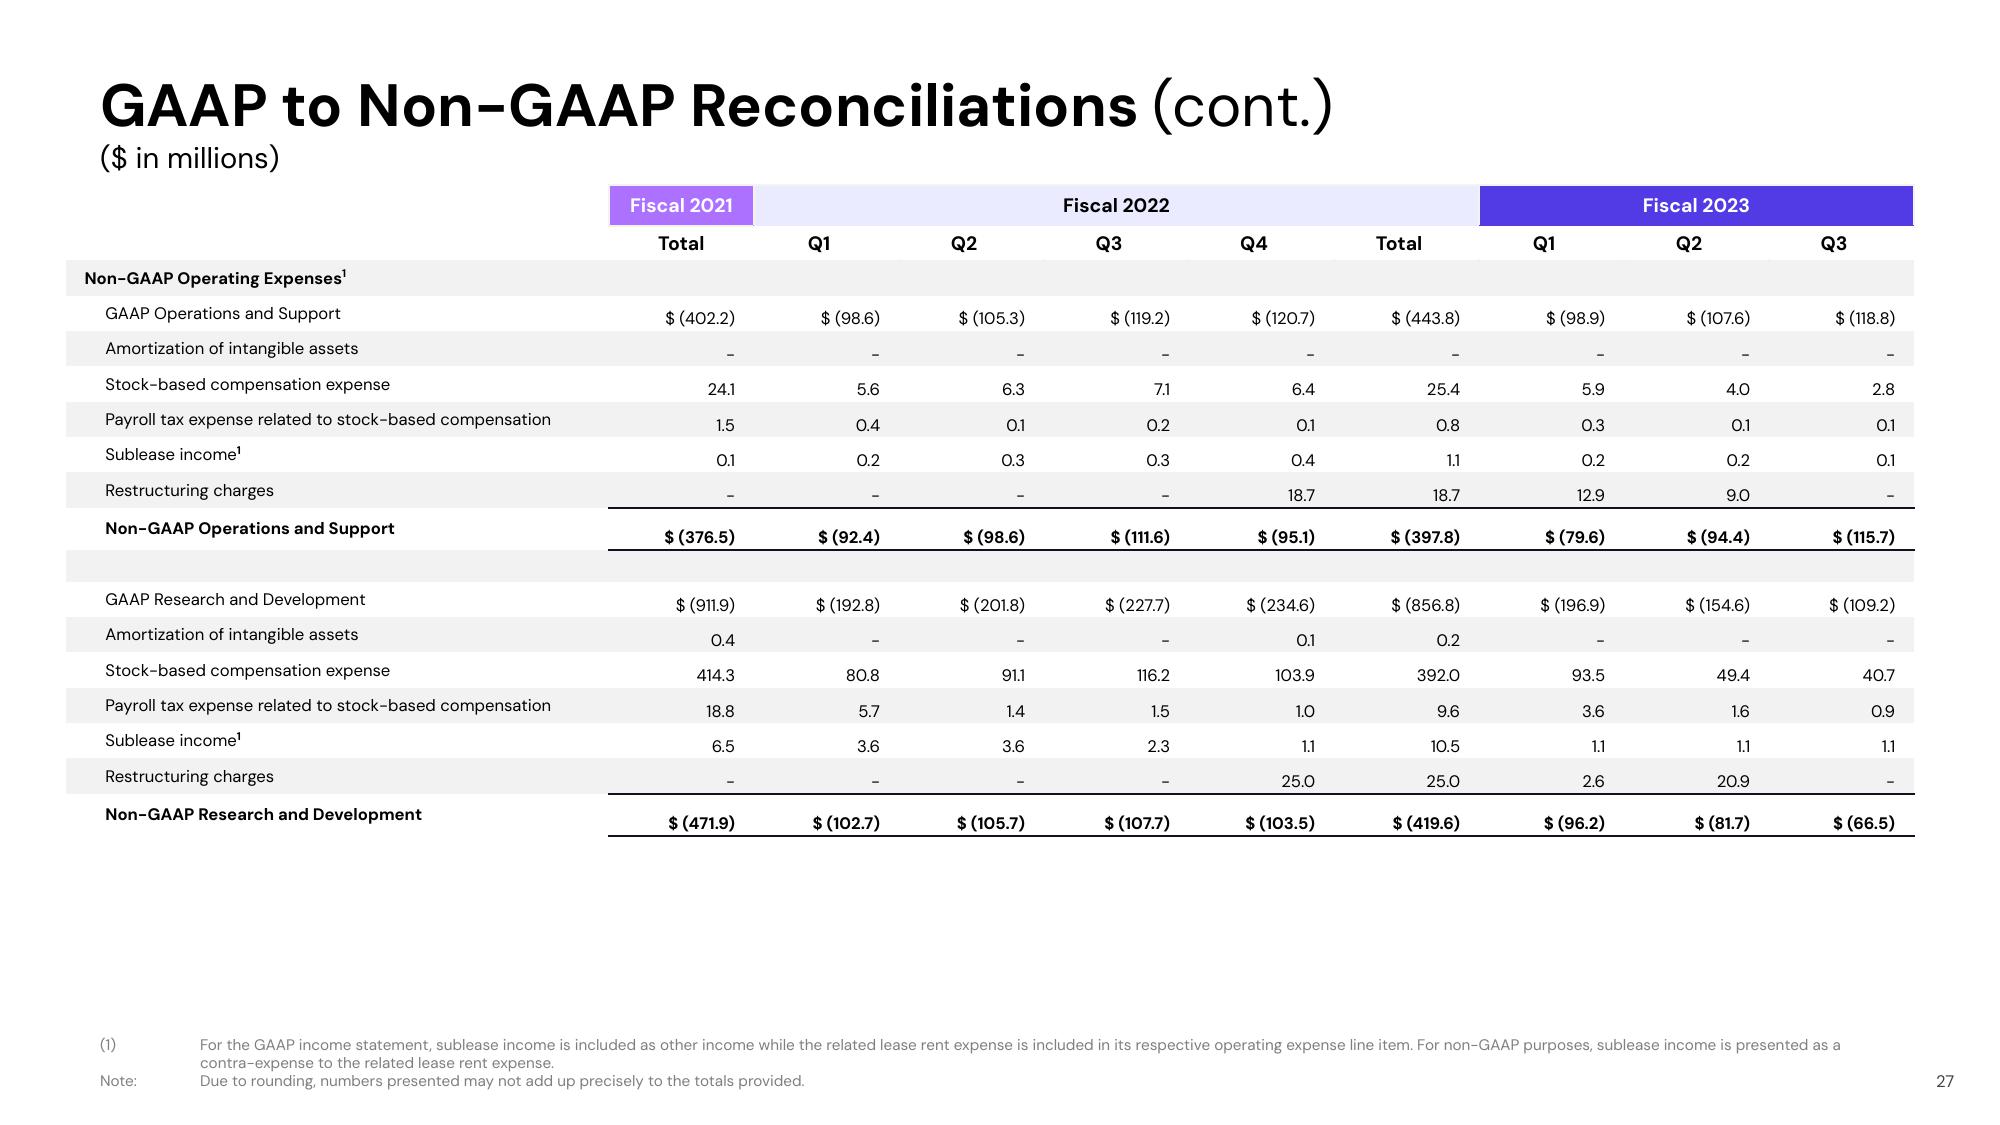
GAAP to Non-GAAP Reconciliations (cont.)
($ in millions)
Non-GAAP Operating Expenses¹
GAAP Operations and Support
Amortization of intangible assets
Stock-based compensation expense
Payroll tax expense related to stock-based compensation
Sublease income¹
Restructuring charges
Non-GAAP Operations and Support
GAAP Research and Development
Amortization of intangible assets
Stock-based compensation expense
Payroll tax expense related to stock-based compensation
Sublease income¹
Restructuring charges
Non-GAAP Research and Development
(1)
Note:
Fiscal 2021
Total
$ (402.2)
24.1
1.5
0.1
$ (376.5)
$ (911.9)
0.4
414.3
18.8
6.5
$ (471.9)
Q1
$ (98.6)
5.6
0.4
0.2
$ (92.4)
$ (192.8)
80.8
5.7
3.6
$ (102.7)
Q2
$ (105.3)
6.3
0.1
0.3
$ (98.6)
$ (201.8)
91.1
1.4
3.6
$ (105.7)
Fiscal 2022
Q3
$ (119.2)
7.1
0.2
0.3
$ (111.6)
$ (227.7)
116.2
1.5
2.3
$ (107.7)
Q4
$ (120.7)
6.4
0.1
0.4
18.7
$ (95.1)
$ (234.6)
0.1
103.9
1.0
1.1
25.0
$ (103.5)
Total
$ (443.8)
25.4
0.8
1.1
18.7
$ (397.8)
$ (856.8)
0.2
392.0
9.6
10.5
25.0
$ (419.6)
Q1
$ (98.9)
5.9
0.3
0.2
12.9
$ (79.6)
$ (196.9)
93.5
3.6
1.1
2.6
$ (96.2)
Fiscal 2023
Q2
$ (107.6)
4.0
0.1
0.2
9.0
$ (94.4)
$ (154.6)
49.4
1.6
1.1
20.9
$ (81.7)
Q3
$(118.8)
2.8
0.1
0.1
$ (115.7)
For the GAAP income statement, sublease income is included as other income while the related lease rent expense is included in its respective operating expense line item. For non-GAAP purposes, sublease income is presented as a
contra-expense to the related lease rent expense.
Due to rounding, numbers presented may not add up precisely to the totals provided.
$ (109.2)
40.7
0.9
1.1
$ (66.5)
27View entire presentation