Fiverr Investor Presentation Deck
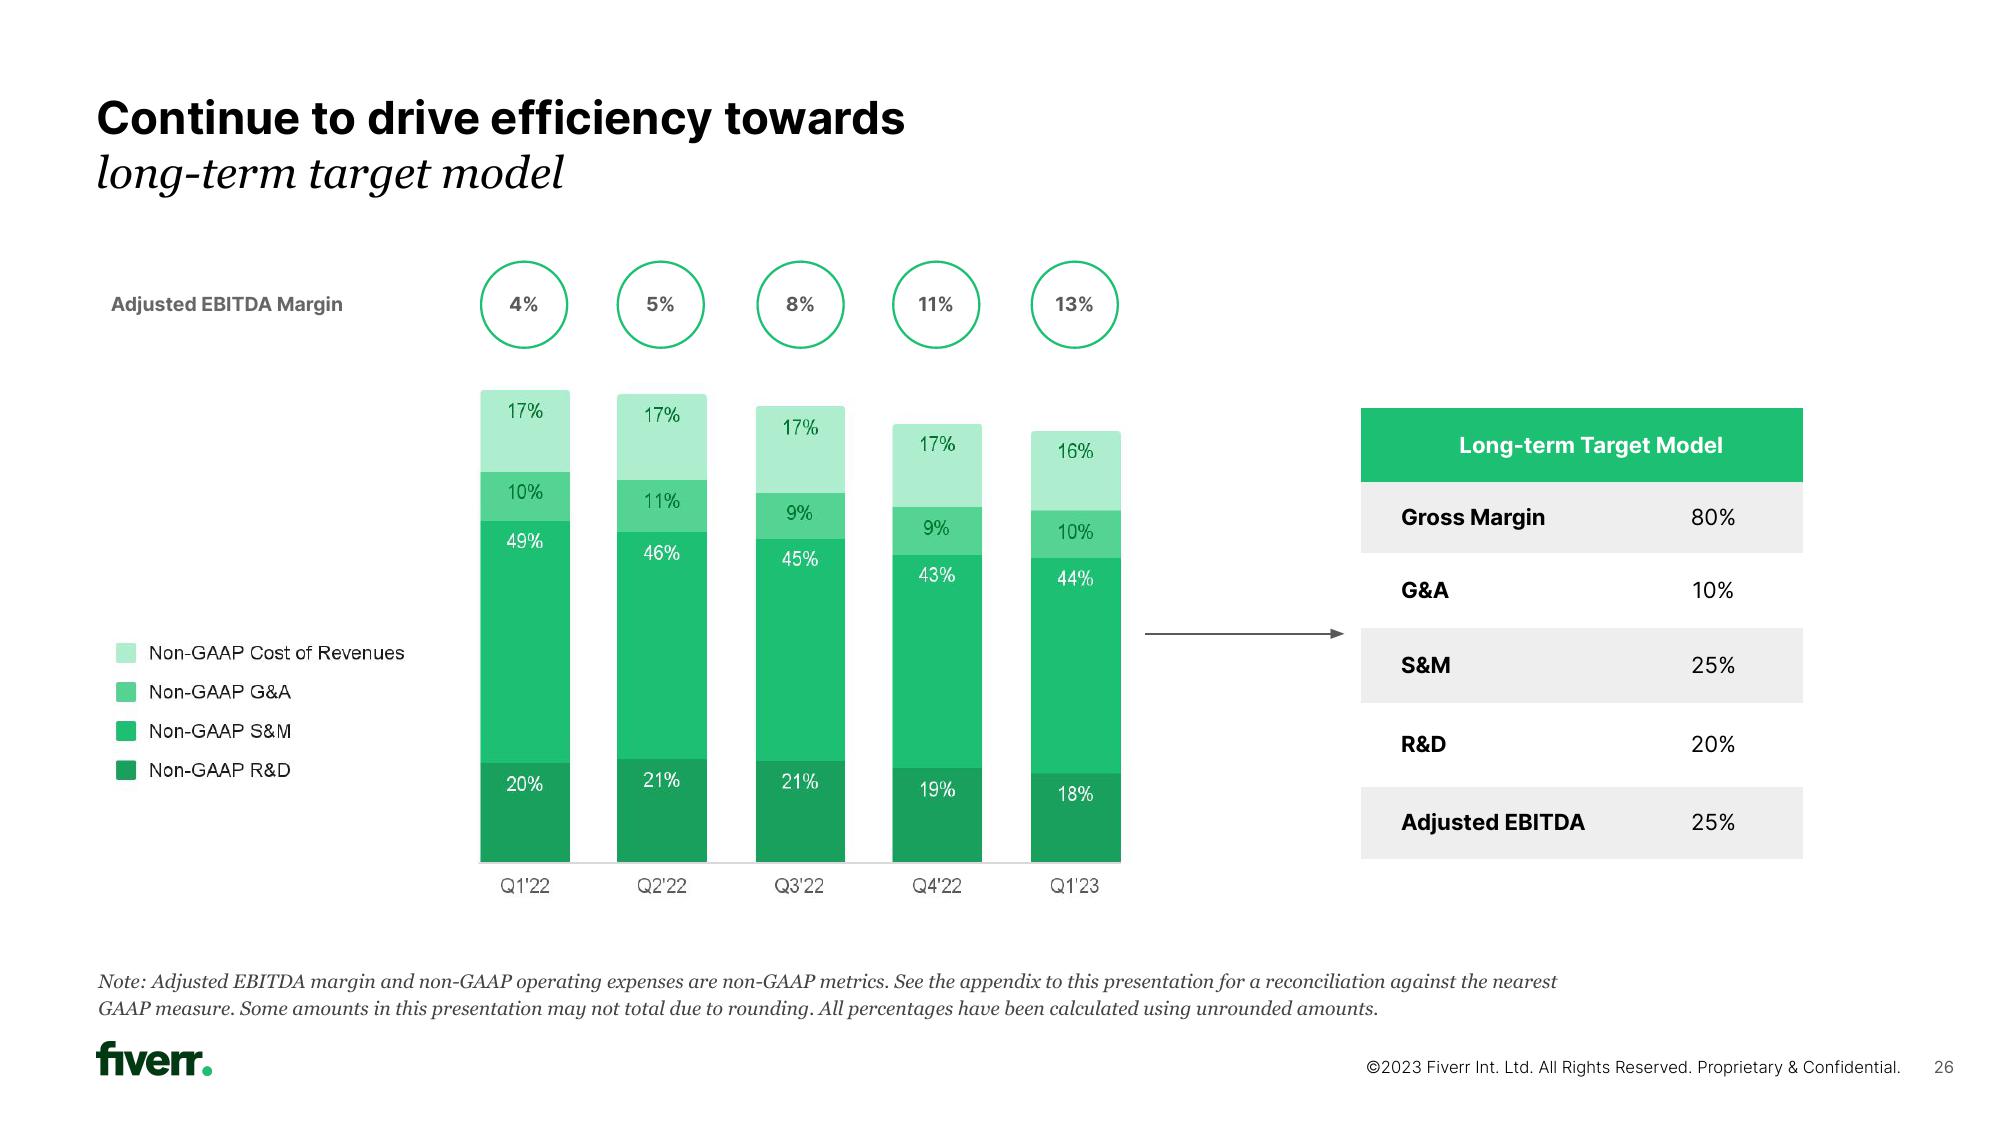
Continue to drive efficiency towards
long-term target model
Adjusted EBITDA Margin
Non-GAAP Cost of Revenues
Non-GAAP G&A
Non-GAAP S&M
Non-GAAP R&D
4%
17%
10%
49%
20%
Q1'22
5%
17%
11%
46%
21%
Q2'22
8%
17%
9%
45%
21%
Q3'22
11%
17%
9%
43%
19%
Q4'22
13%
16%
10%
44%
18%
Q1'23
Gross Margin
G&A
S&M
Long-term Target Model
R&D
Adjusted EBITDA
Note: Adjusted EBITDA margin and non-GAAP operating expenses are non-GAAP metrics. See the appendix to this presentation for a reconciliation against the nearest
GAAP measure. Some amounts in this presentation may not total due to rounding. All percentages have been calculated using unrounded amounts.
fiverr.
80%
10%
25%
20%
25%
Ⓒ2023 Fiverr Int. Ltd. All Rights Reserved. Proprietary & Confidential.
26View entire presentation