Confluent IPO Presentation Deck
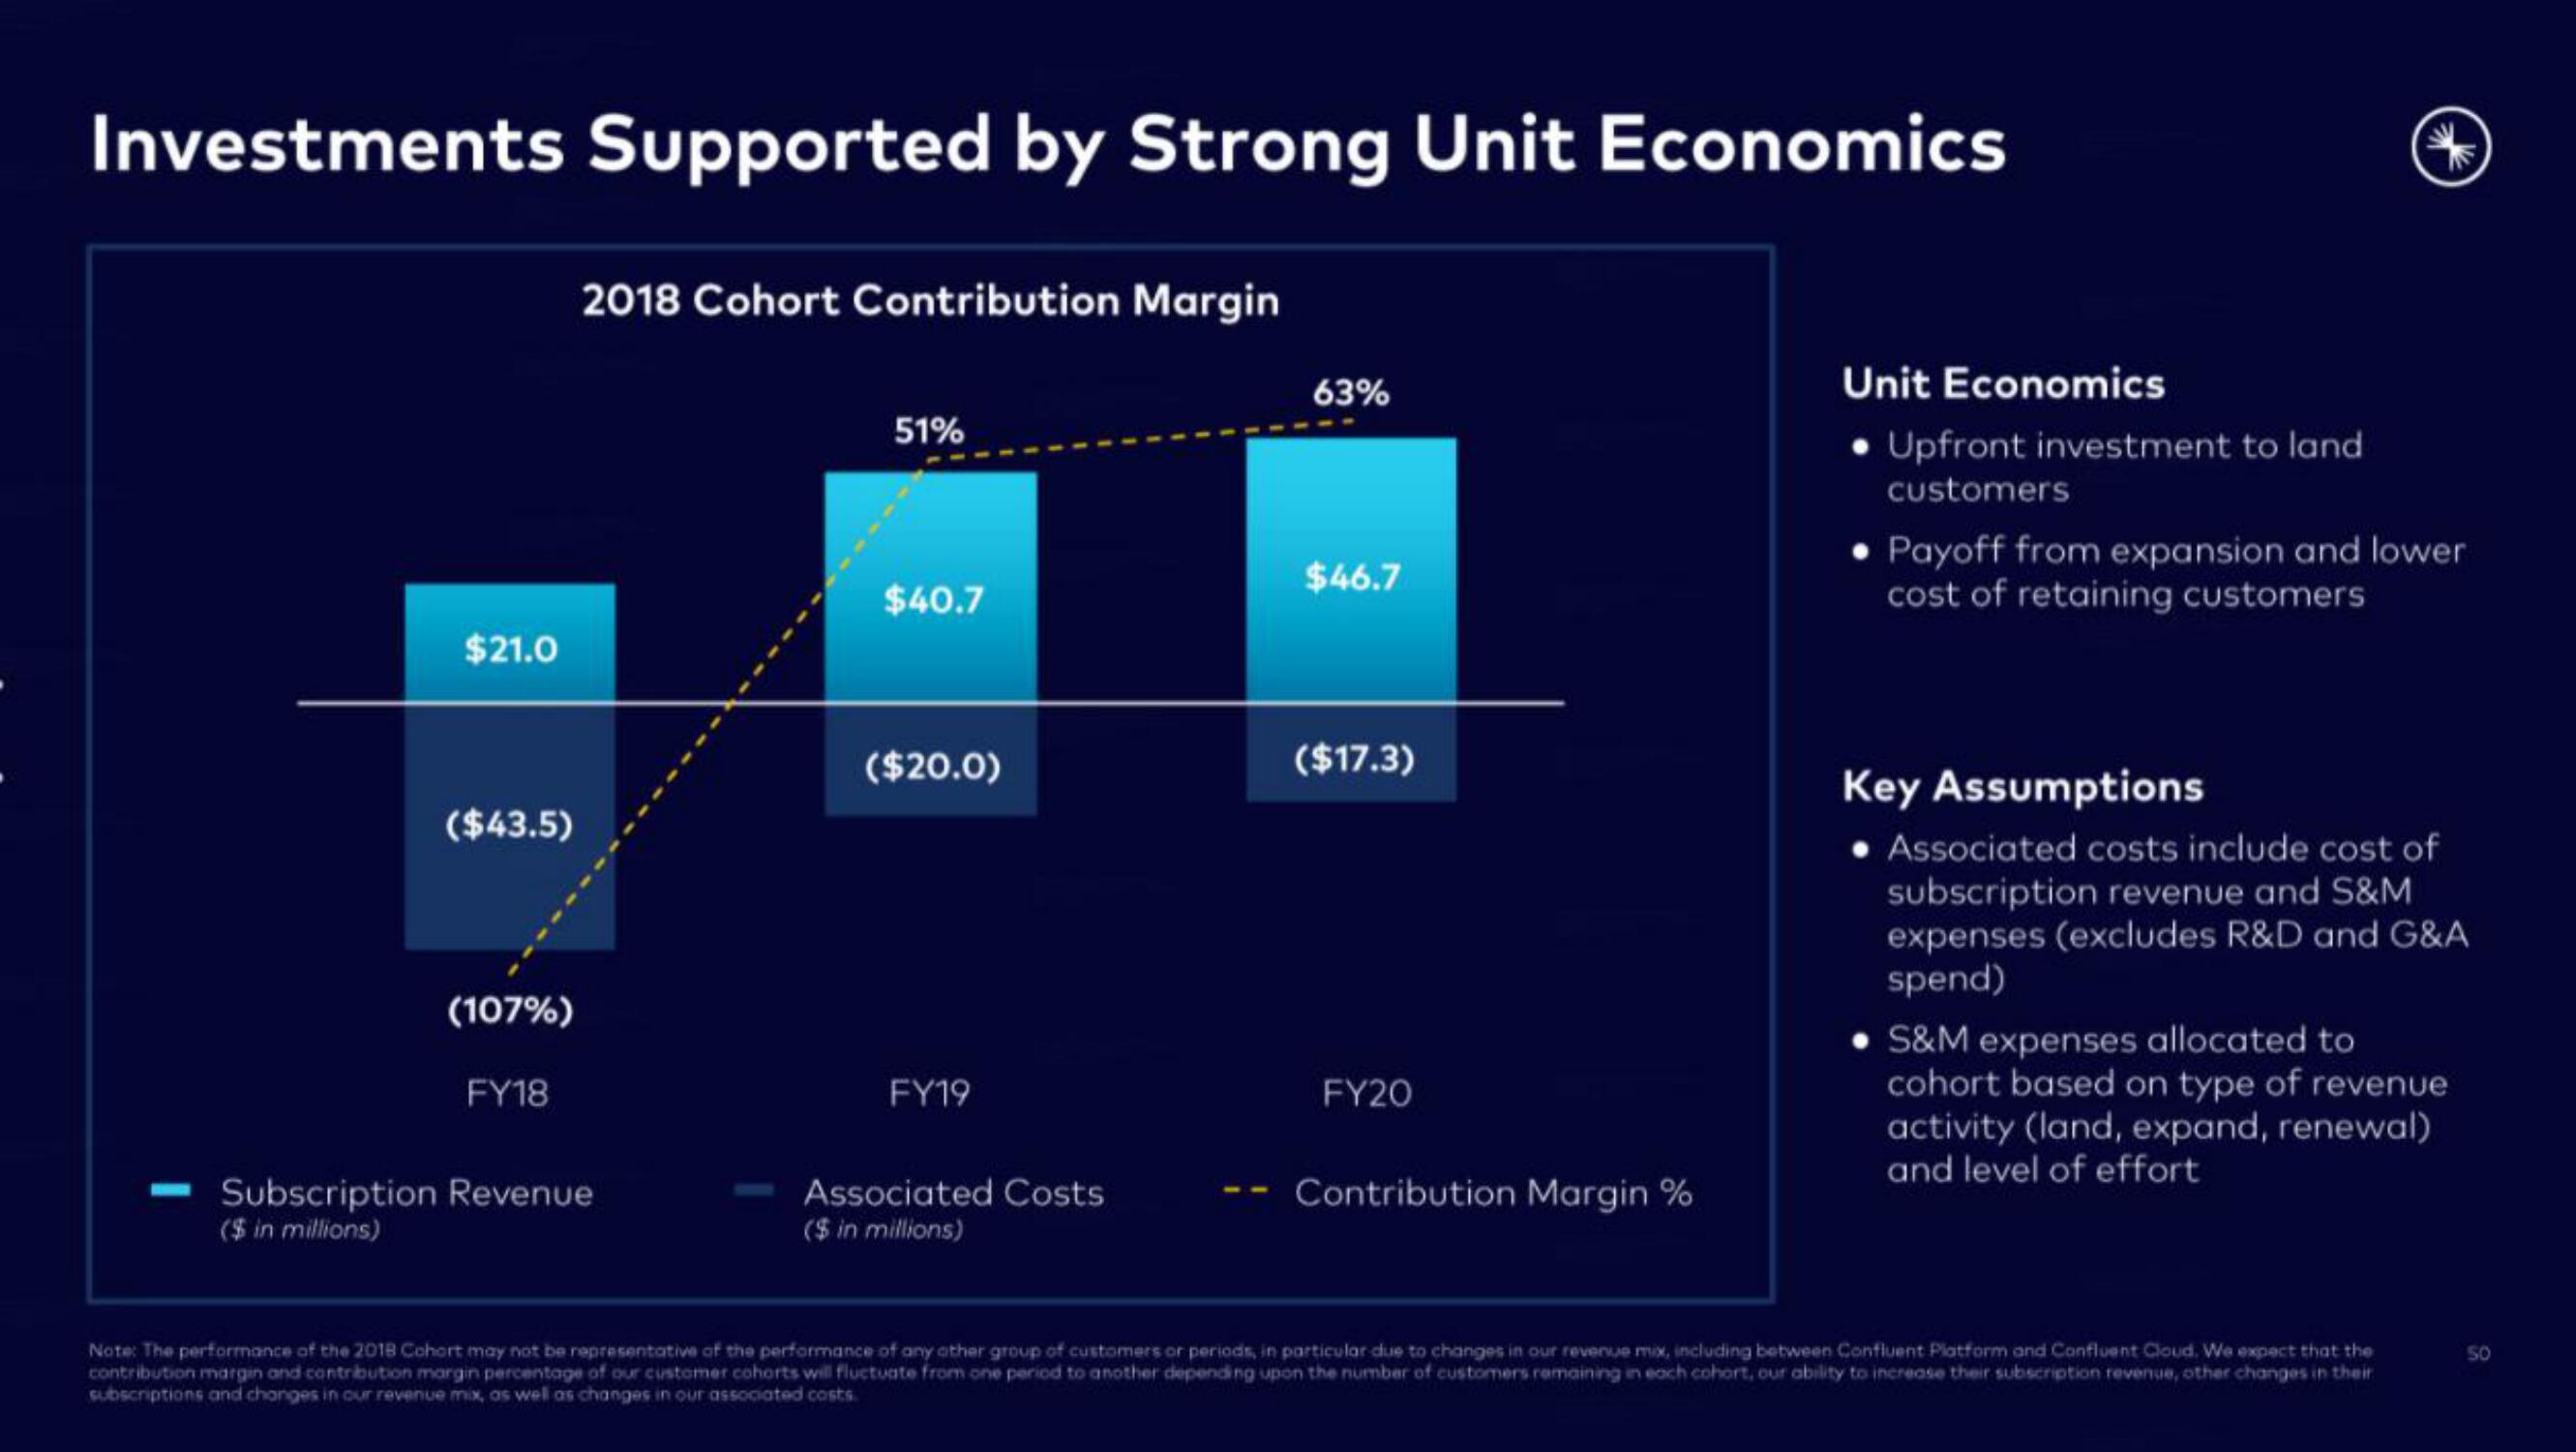
Investments Supported by Strong Unit Economics
$21.0
($43.5)
(107%)
FY18
2018 Cohort Contribution Margin
Subscription Revenue
($ in millions)
51%
$40.7
($20.0)
FY19
Associated Costs
($ in millions)
63%
$46.7
($17.3)
FY20
Contribution Margin %
Unit Economics
• Upfront investment to land
customers
Payoff from expansion and lower
cost of retaining customers
Key Assumptions
Associated costs include cost of
subscription revenue and S&M
expenses (excludes R&D and G&A
spend)
• S&M expenses allocated to
cohort based on type of revenue
activity (land, expand, renewal)
and level of effort
Note: The performance of the 2018 Cohort may not be representative of the performance of any other group of customers or periods, in particular due to changes in our revenue mix, including between Confluent Platform and Confluent Cloud. We expect that the
contribution margin and contribution margin percentage of our customer cohorts will fluctuate from one period to another depending upon the number of customers remaining in each cohort, our ability to increase their subscription revenue, other changes in their
subscriptions and changes in our revenue mix, as well as changes in our associated costs.
50View entire presentation