jetBlue Results Presentation Deck
Operating Expense, Income before Taxes, Net Income and Earnings per Share, excluding special items and gain on equity method investments
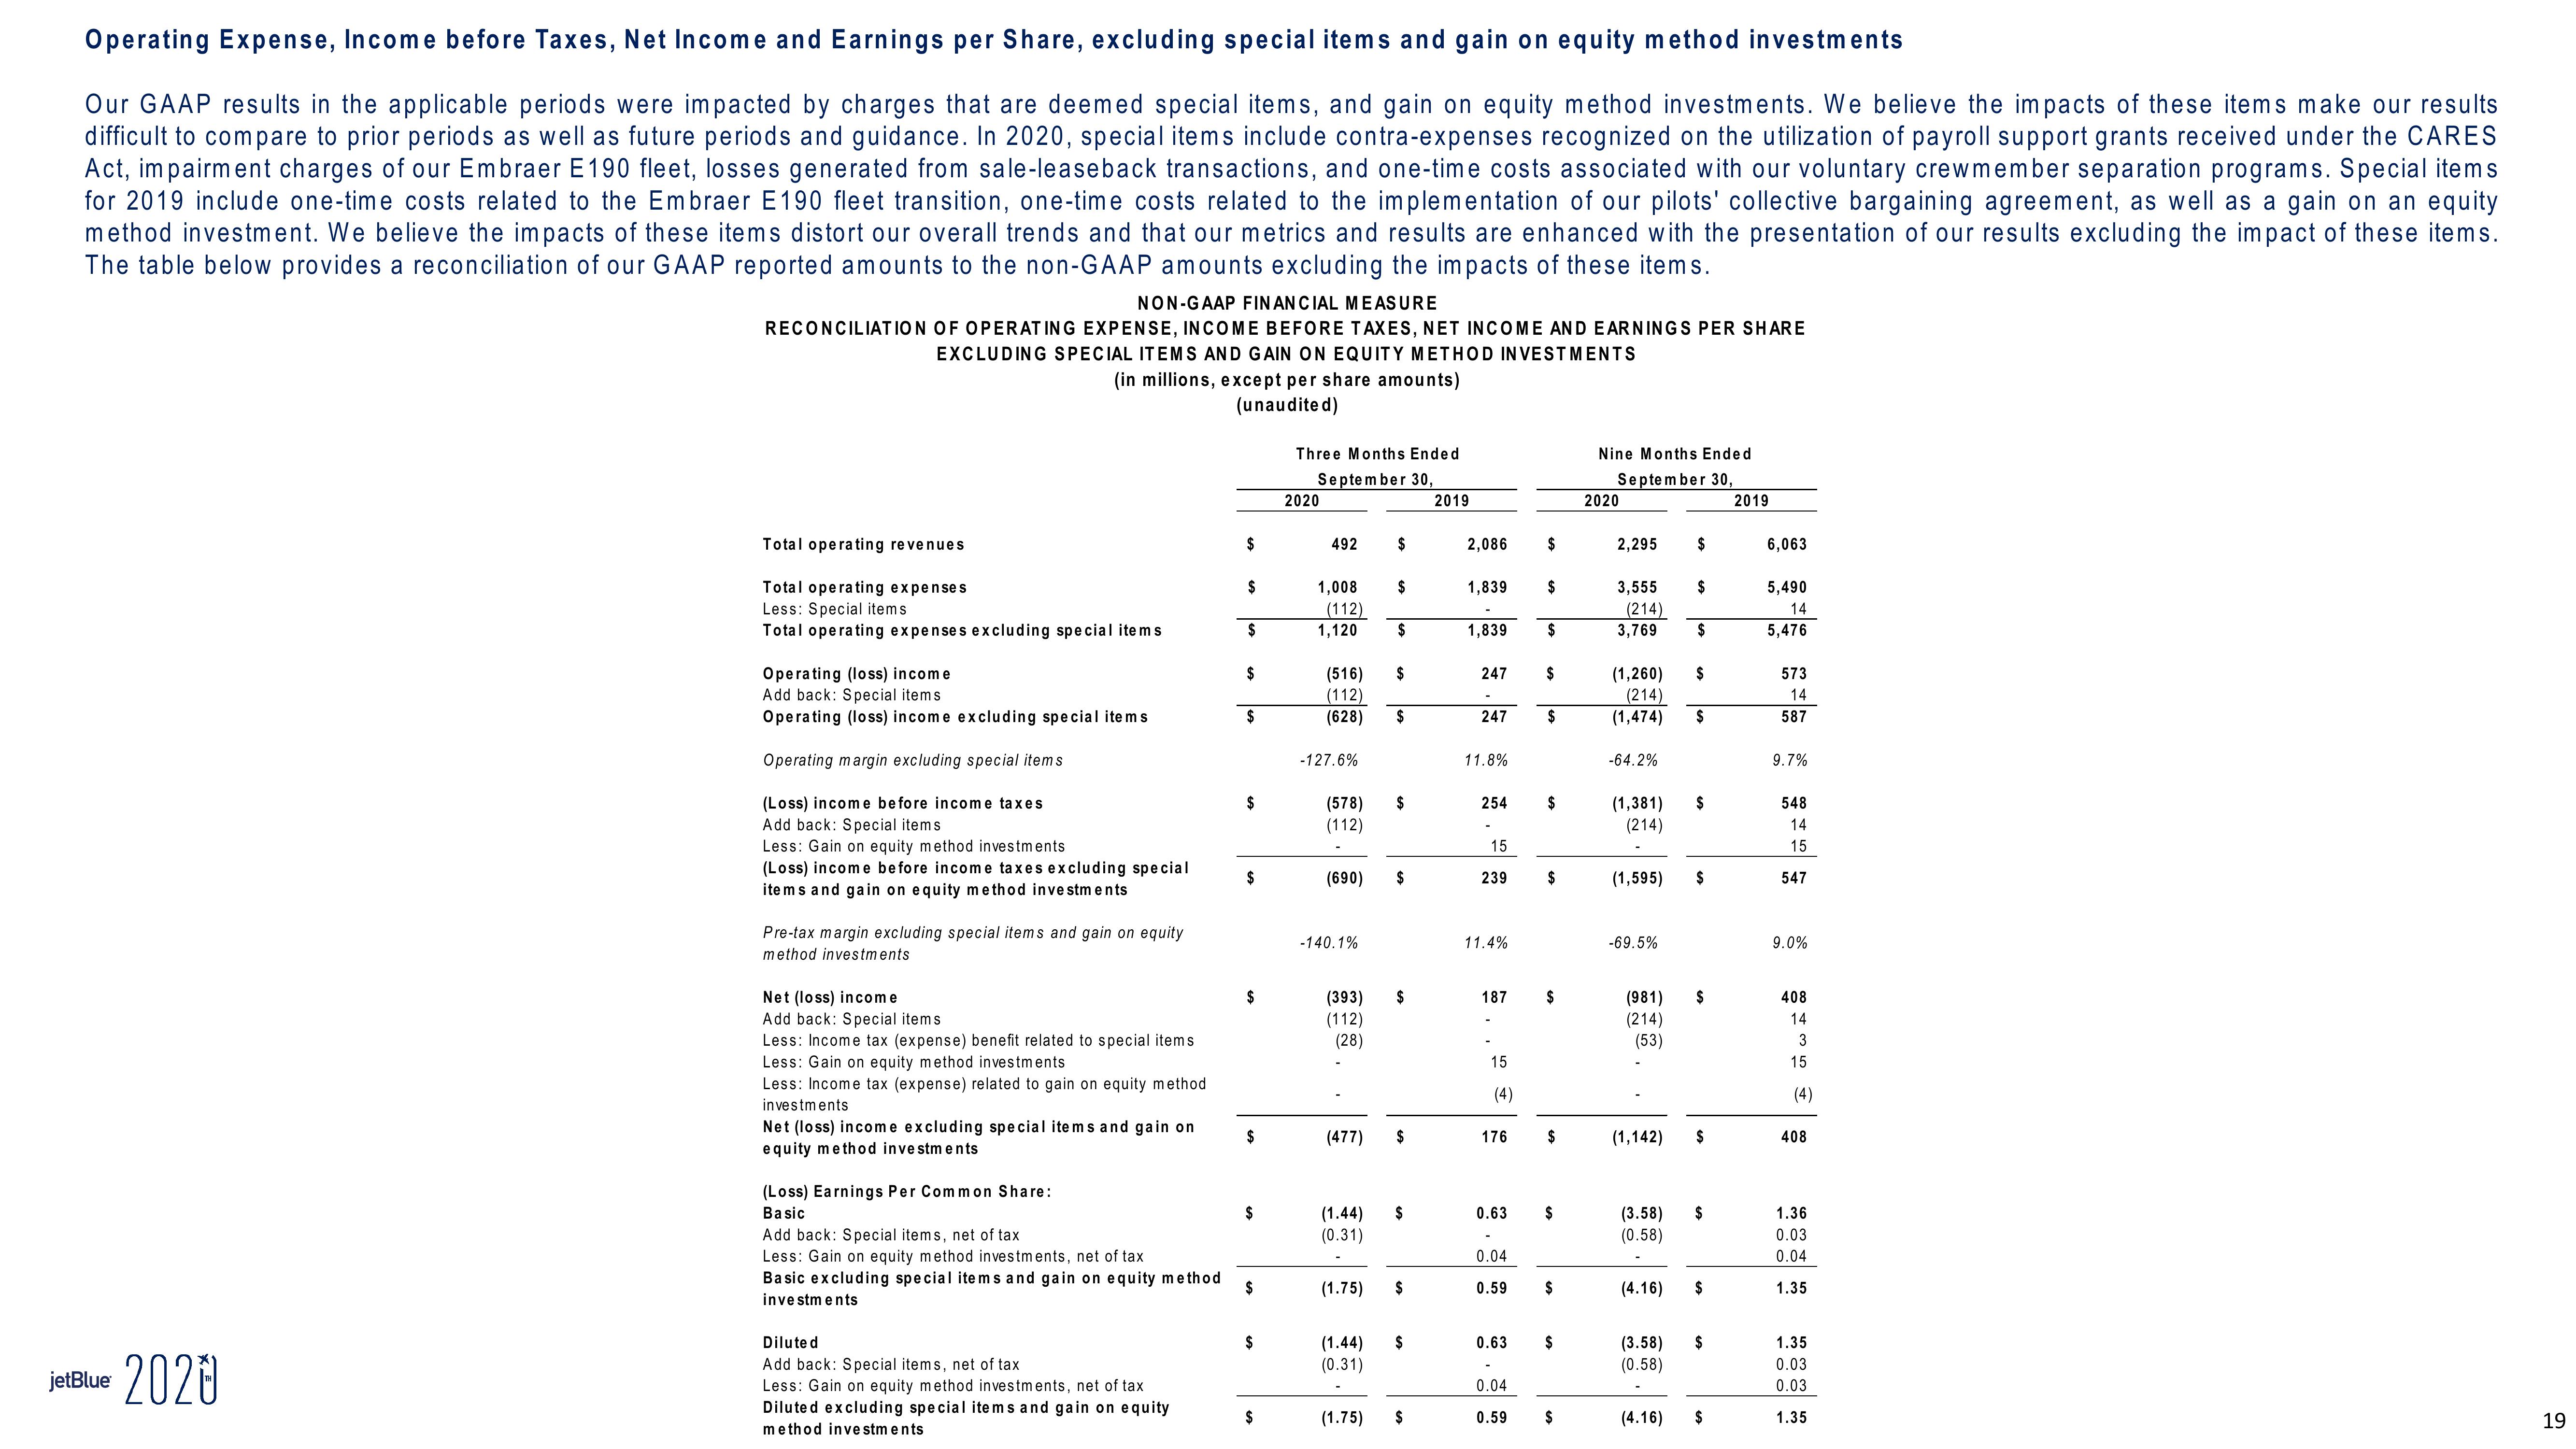
Our GAAP results in the applicable periods were impacted by charges that are deemed special items, and gain on equity method investments. We believe the impacts of these items make our results
difficult to compare to prior periods as well as future periods and guidance. In 2020, special items include contra-expenses recognized on the utilization of payroll support grants received under the CARES
Act, impairment charges of our Embraer E190 fleet, losses generated from sale-leaseback transactions, and one-time costs associated with our voluntary crew member separation programs. Special items
for 2019 include one-time costs related to the Embraer E190 fleet transition, one-time costs related to the implementation of our pilots' collective bargaining agreement, as well as a gain on an equity
method investment. We believe the impacts of these items distort our overall trends and that our metrics and results are enhanced with the presentation of our results excluding the impact of these items.
The table below provides a reconciliation of our GAAP reported amounts to the non-GAAP amounts excluding the impacts of these items.
jetBlue 2020
NON-GAAP FINANCIAL MEASURE
RECONCILIATION OF OPERATING EXPENSE, INCOME BEFORE TAXES, NET INCOME AND EARNINGS PER SHARE
EXCLUDING SPECIAL ITEMS AND GAIN ON EQUITY METHOD INVESTMENTS
(in millions, except per share amounts)
(unaudited)
Total operating revenues
Total operating expenses
Less: Special items
Total operating expenses excluding special items
Operating (loss) income
Add back: Special items
Operating (loss) income excluding special items
Operating margin excluding special items
(Loss) income before income taxes
Add back: Special items.
Less: Gain on equity method investments
(Loss) income before income taxes excluding special
items and gain on equity method investments
Pre-tax margin excluding special items and gain on equity
method investments
Net (loss) income
Add back: Special items.
Less: Income tax (expense) benefit related to special items.
Less: Gain on equity method investments
Less: Income tax (expense) related to gain on equity method
investments
Net (loss) income excluding special items and gain on
equity method investments
(Loss) Earnings Per Common Share:
Basic
Add back: Special items, net of tax
Less: Gain on equity method investments, net of tax
Basic excluding special items and gain on equity method
investments
Diluted
Add back: Special items, net of tax
Less: Gain on equity method investments, net of tax
Diluted excluding special items and gain on equity
method investments
$
$
$
$
$
$
$
$
$
$
$
$
$
Three Months Ended
September 30,
2019
2020
492
1,008
(112)
1,120 $
(516)
(112)
(628)
-127.6%
(578)
(112)
(690)
-140.1%
(393)
(112)
(28)
(477)
(1.44)
(0.31)
(1.75)
(1.44)
(0.31)
$
(1.75)
$
$
$
$
$
$
$
$
$
$
$
2,086
1,839
1,839
247
247
11.8%
254
15
239
11.4%
187
15
(4)
176
0.63
0.04
0.59
0.63
0.04
0.59
$
$
$
S
$
$
$
$
$
$
$
$
$
Nine Months Ended
September 30,
2020
2,295 $
3,555
(214)
3,769 $
(1,260)
(214)
(1,474)
-64.2%
(1,381)
(214)
-69.5%
(981)
(214)
(53)
(1,595) $
(3.58)
(0.58)
$
(4.16)
(3.58)
(0.58)
$
(4.16)
$
(1,142) $
$
$
$
$
$
$
2019
6,063
5,490
14
5,476
573
14
587
9.7%
548
14
15
547
9.0%
408
14
3
15
(4)
408
1.36
0.03
0.04
1.35
1.35
0.03
0.03
1.35
19View entire presentation