Pathward Financial Results Presentation Deck
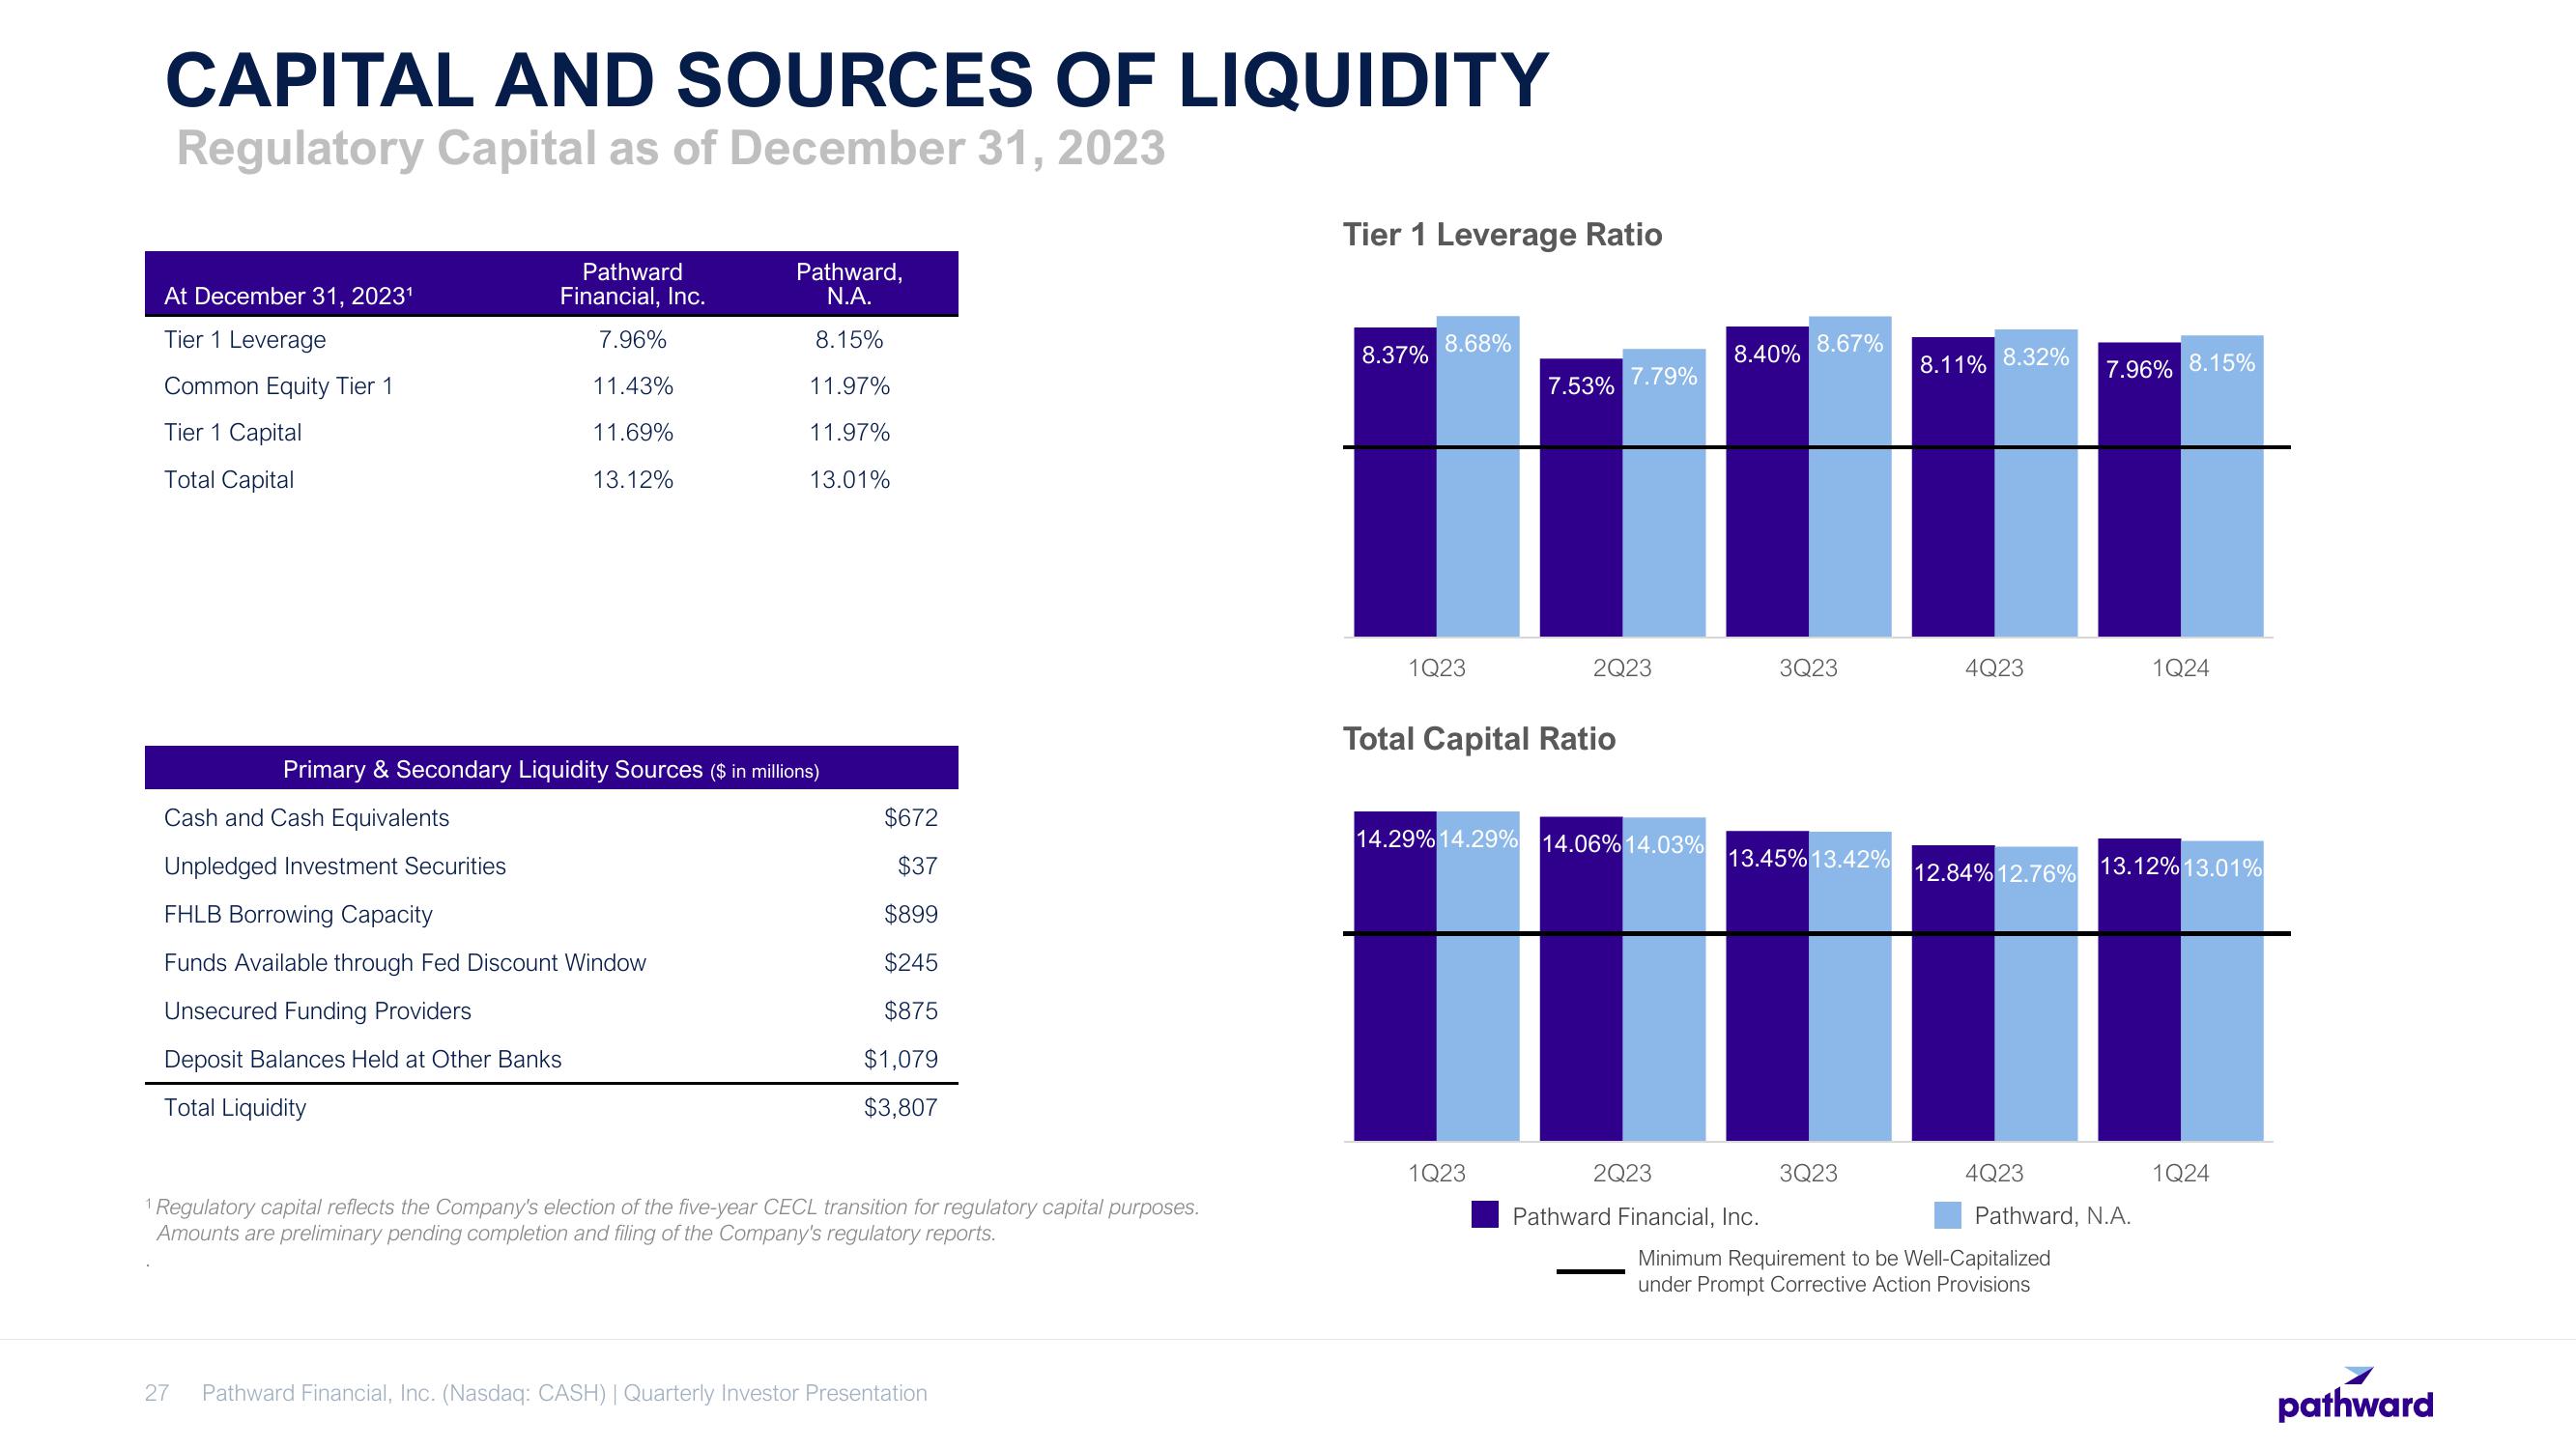
CAPITAL AND SOURCES OF LIQUIDITY
Regulatory Capital as of December 31, 2023
At December 31, 2023¹
Tier 1 Leverage
Common Equity Tier 1
Tier 1 Capital
Total Capital
Pathward
Financial, Inc.
7.96%
11.43%
11.69%
13.12%
Pathward,
N.A.
8.15%
11.97%
11.97%
13.01%
Primary & Secondary Liquidity Sources ($ in millions)
Cash and Cash Equivalents
Unpledged Investment Securities
FHLB Borrowing Capacity
Funds Available through Fed Discount Window
Unsecured Funding Providers
Deposit Balances Held at Other Banks
Total Liquidity
$672
$37
$899
$245
$875
$1,079
$3,807
1 Regulatory capital reflects the Company's election of the five-year CECL transition for regulatory capital purposes.
Amounts are preliminary pending completion and filing of the Company's regulatory reports.
27 Pathward Financial, Inc. (Nasdaq: CASH) | Quarterly Investor Presentation
Tier 1 Leverage Ratio
8.37%
8.68%
1Q23
7.53%
Total Capital Ratio
1Q23
7.79%
2Q23
8.40%
2Q23
14.29% 14.29% 14.06% 14.03%
HII
8.67%
3Q23
Pathward Financial, Inc.
13.45% 13.42%
3Q23
8.11% 8.32%
4Q23
4Q23
7.96% 8.15%
12.84% 12.76% 13.12% 13.01%
Pathward, N.A.
Minimum Requirement to be Well-Capitalized
under Prompt Corrective Action Provisions
1Q24
1Q24
pathwardView entire presentation