Lyft Investor Presentation Deck
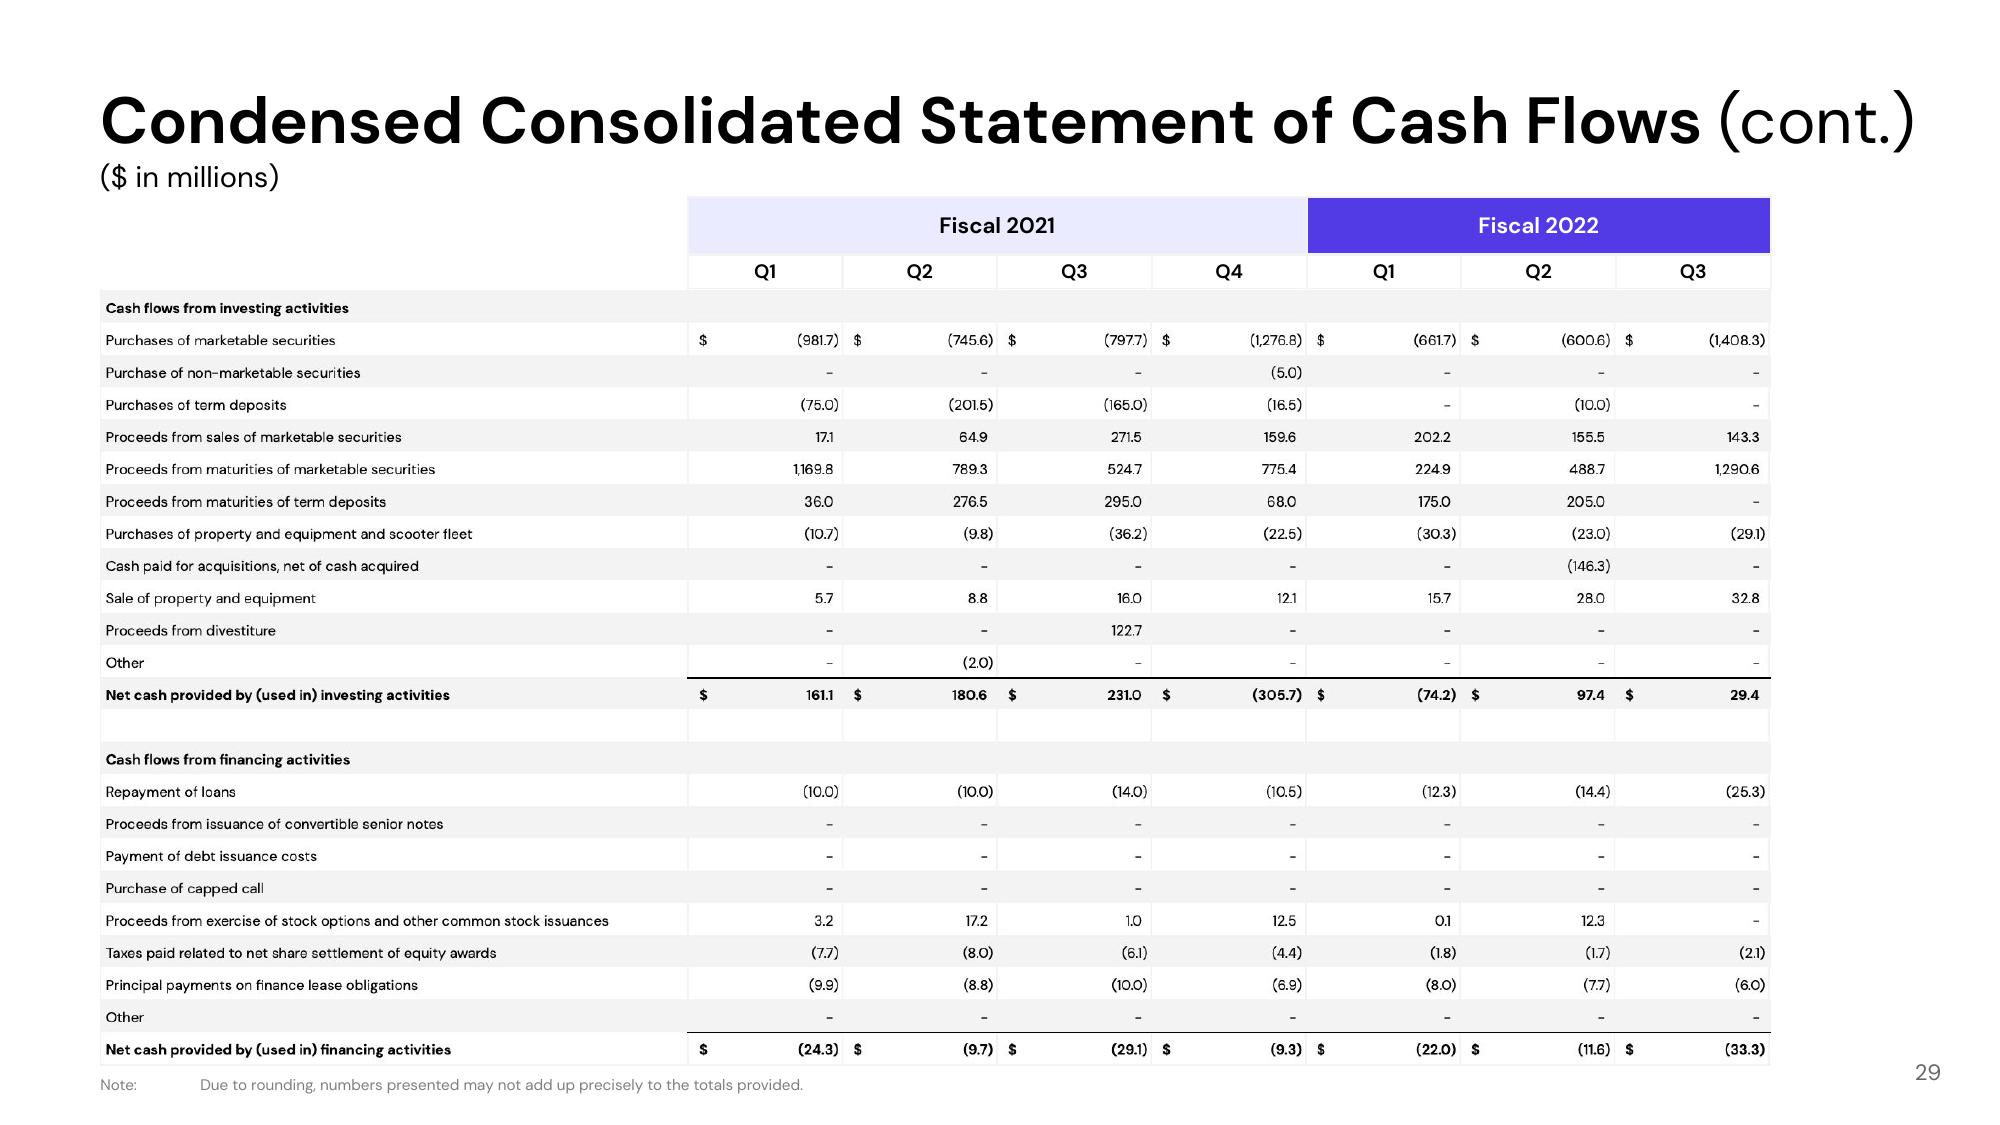
Condensed Consolidated Statement of Cash Flows (cont.)
($ in millions)
Cash flows from investing activities
Purchases of marketable securities
Purchase of non-marketable securities
Purchases of term deposits
Proceeds from sales of marketable securities
Proceeds from maturities of marketable securities
Proceeds from maturities of term deposits
Purchases of property and equipment and scooter fleet
Cash paid for acquisitions, net of cash acquired
Sale of property and equipment
Proceeds from divestiture
Other
Net cash provided by (used in) investing activities
Cash flows from financing activities
Repayment of loans
Proceeds from issuance of convertible senior notes
Payment of debt issuance costs
Purchase of capped call
Proceeds from exercise of stock options and other common stock issuances
Taxes paid related to net share settlement of equity awards
Principal payments on finance lease obligations
Other
Net cash provided by (used in) financing activities
Note:
$
$
$
Q1
(981.7) $
(75.0)
17.1
1,169.8
36.0
(10.7)
5.7
Due to rounding, numbers presented may not add up precisely to the totals provided.
161.1
(10.0)
3.2
(7.7)
(9.9)
$
(24.3) $
Q2
Fiscal 2021
(745.6) $
(201.5)
64.9
789.3
276.5
(9.8)
8.8
(2.0)
180.6
(10.0)
17.2
(8.0)
(8.8)
$
(9.7) $
Q3
(7977) $
(165.0)
271.5
524.7
295.0
(36.2)
16.0
122.7
231.0
(14.0)
1.0
(6.1)
(10.0)
$
(29.1) S
Q4
(1,276.8) $
(5.0)
(16.5)
159.6
775.4
68.0
(22.5)
12.1
(305.7) $
(10.5)
12.5
(4.4)
(6.9)
(9.3) $
Q1
(661.7) $
202.2
224.9
175.0
(30.3)
15.7
(74.2) $
(12.3)
Fiscal 2022
0.1
(1.8)
(8.0)
(22.0) $
Q2
(600.6) $
(10.0)
155.5
488.7
205.0
(23.0)
(146.3)
28.0
97.4
(14.4)
12.3
(1.7)
(7.7)
$
(11.6) S
Q3
(1,408.3)
143.3
1,290.6
(29.1)
32.8
29.4
(25.3)
(2.1)
(6.0)
(33.3)
29View entire presentation