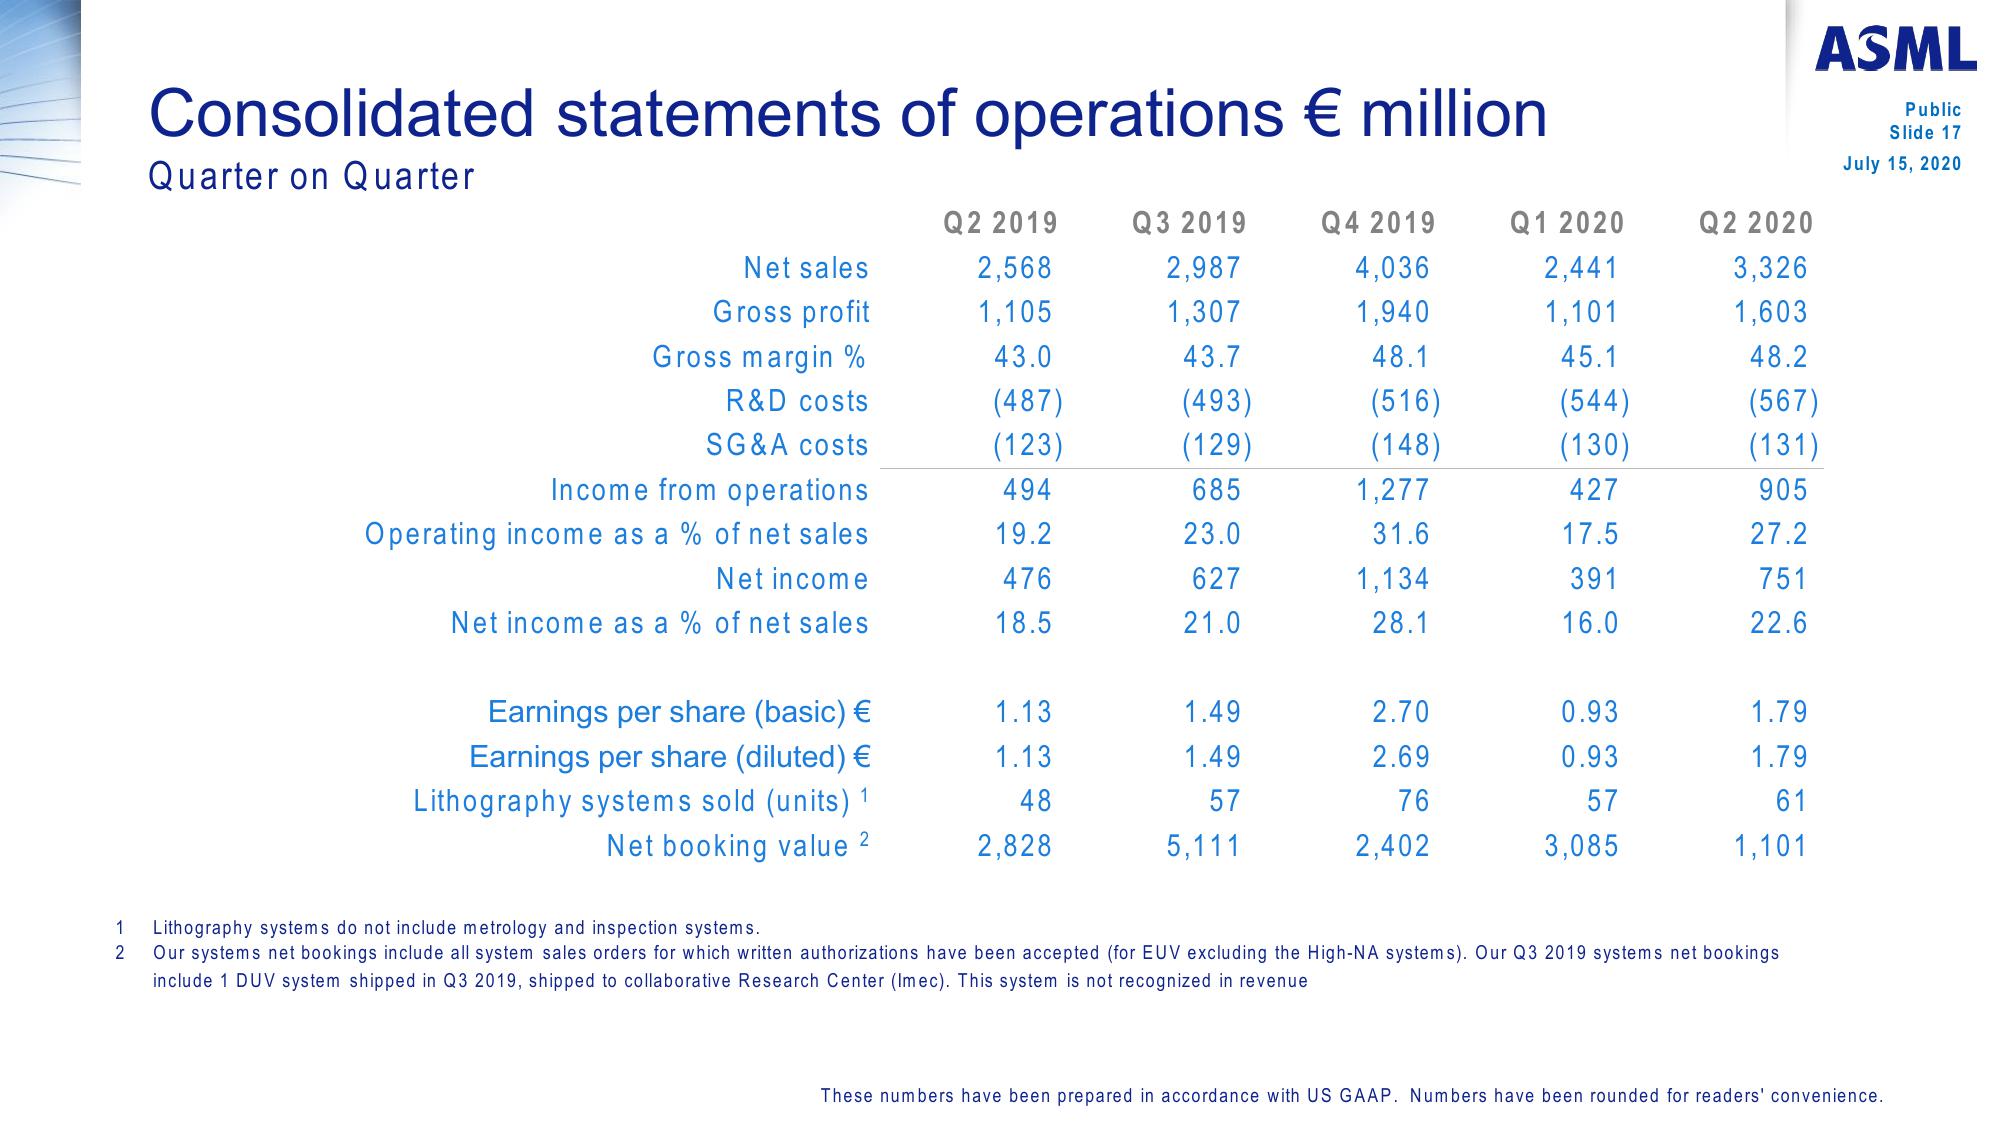
ASML Reports €3.3 Billion Net Sales at 48.2% Gross Margin in Q2
1
2
Consolidated statements of operations € million
Quarter on Quarter
Net sales
Gross profit
Gross margin %
R&D costs
SG&A costs
Income from operations
Operating income as a % of net sales
Net income
Net income as a % of net sales
Earnings per share (basic) €
Earnings per share (diluted) €
Lithography systems sold (units) 1
Net booking value ²
Q2 2019
2,568
1,105
43.0
(487)
(123)
494
19.2
476
18.5
1.13
1.13
48
2,828
Q3 2019
2,987
1,307
43.7
(493)
(129)
685
23.0
627
21.0
1.49
1.49
57
5,111
Q4 2019
4,036
1,940
48.1
(516)
(148)
1,277
31.6
1,134
28.1
2.70
2.69
76
2,402
Q1 2020
2,441
1,101
45.1
(544)
(130)
427
17.5
391
16.0
0.93
0.93
57
3,085
Q2 2020
3,326
1,603
48.2
ASML
(567)
(131)
905
27.2
751
22.6
1.79
1.79
61
1,101
Lithography systems do not include metrology and inspection systems.
Our systems net bookings include all system sales orders for which written authorizations have been accepted (for EUV excluding the High-NA systems). Our Q3 2019 systems net bookings.
include 1 DUV system shipped in Q3 2019, shipped to collaborative Research Center (Imec). This system is not recognized in revenue
Public
Slide 17
July 15, 2020
These numbers have been prepared in accordance with US GAAP. Numbers have been rounded for readers' convenience.View entire presentation