WeWork SPAC Presentation Deck
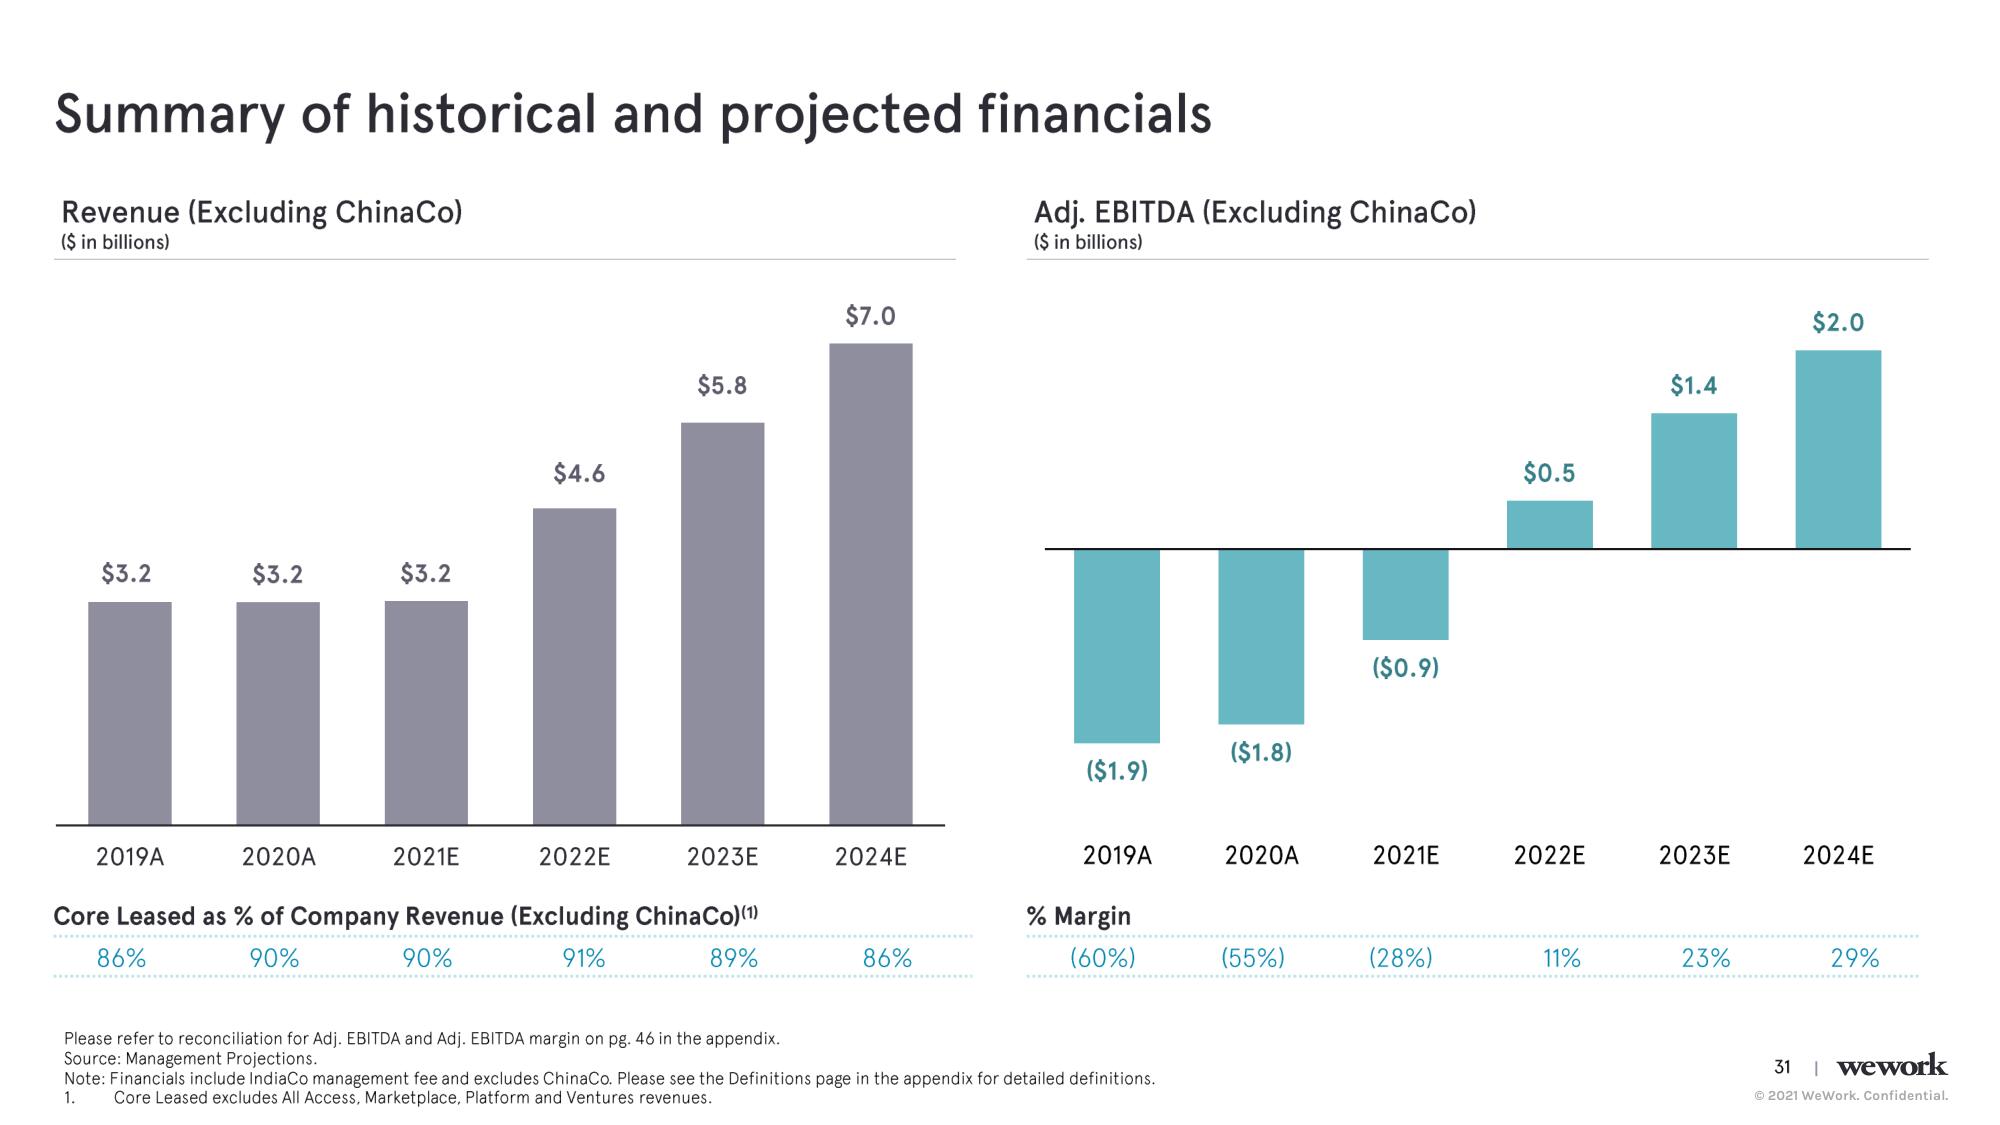
Summary of historical and projected financials
Revenue (Excluding ChinaCo)
($ in billions)
$3.2
1
2019A
$3.2
2020A
$3.2
2021E
$4.6
2022E
$5.8
2023E
Core Leased as % of Company Revenue (Excluding ChinaCo)(1)
86%
90%
90%
91%
89%
Please refer to reconciliation for Adj. EBITDA and Adj. EBITDA margin on pg. 46 in the appendix.
Source: Management Projections.
$7.0
2024E
86%
Adj. EBITDA (Excluding ChinaCo)
($ in billions)
($1.9)
2019A
% Margin
(60%)
Note: Financials include IndiaCo management fee and excludes ChinaCo. Please see the Definitions page in the appendix for detailed definitions.
Core Leased excludes All Access, Marketplace, Platform and Ventures revenues.
1.
($1.8)
2020A
(55%)
($0.9)
2021E
(28%)
$0.5
2022E
11%
$1.4
2023E
23%
$2.0
2024E
29%
31 | wework
Ⓒ2021 WeWork. Confidential.View entire presentation