PropertyGuru SPAC Presentation Deck
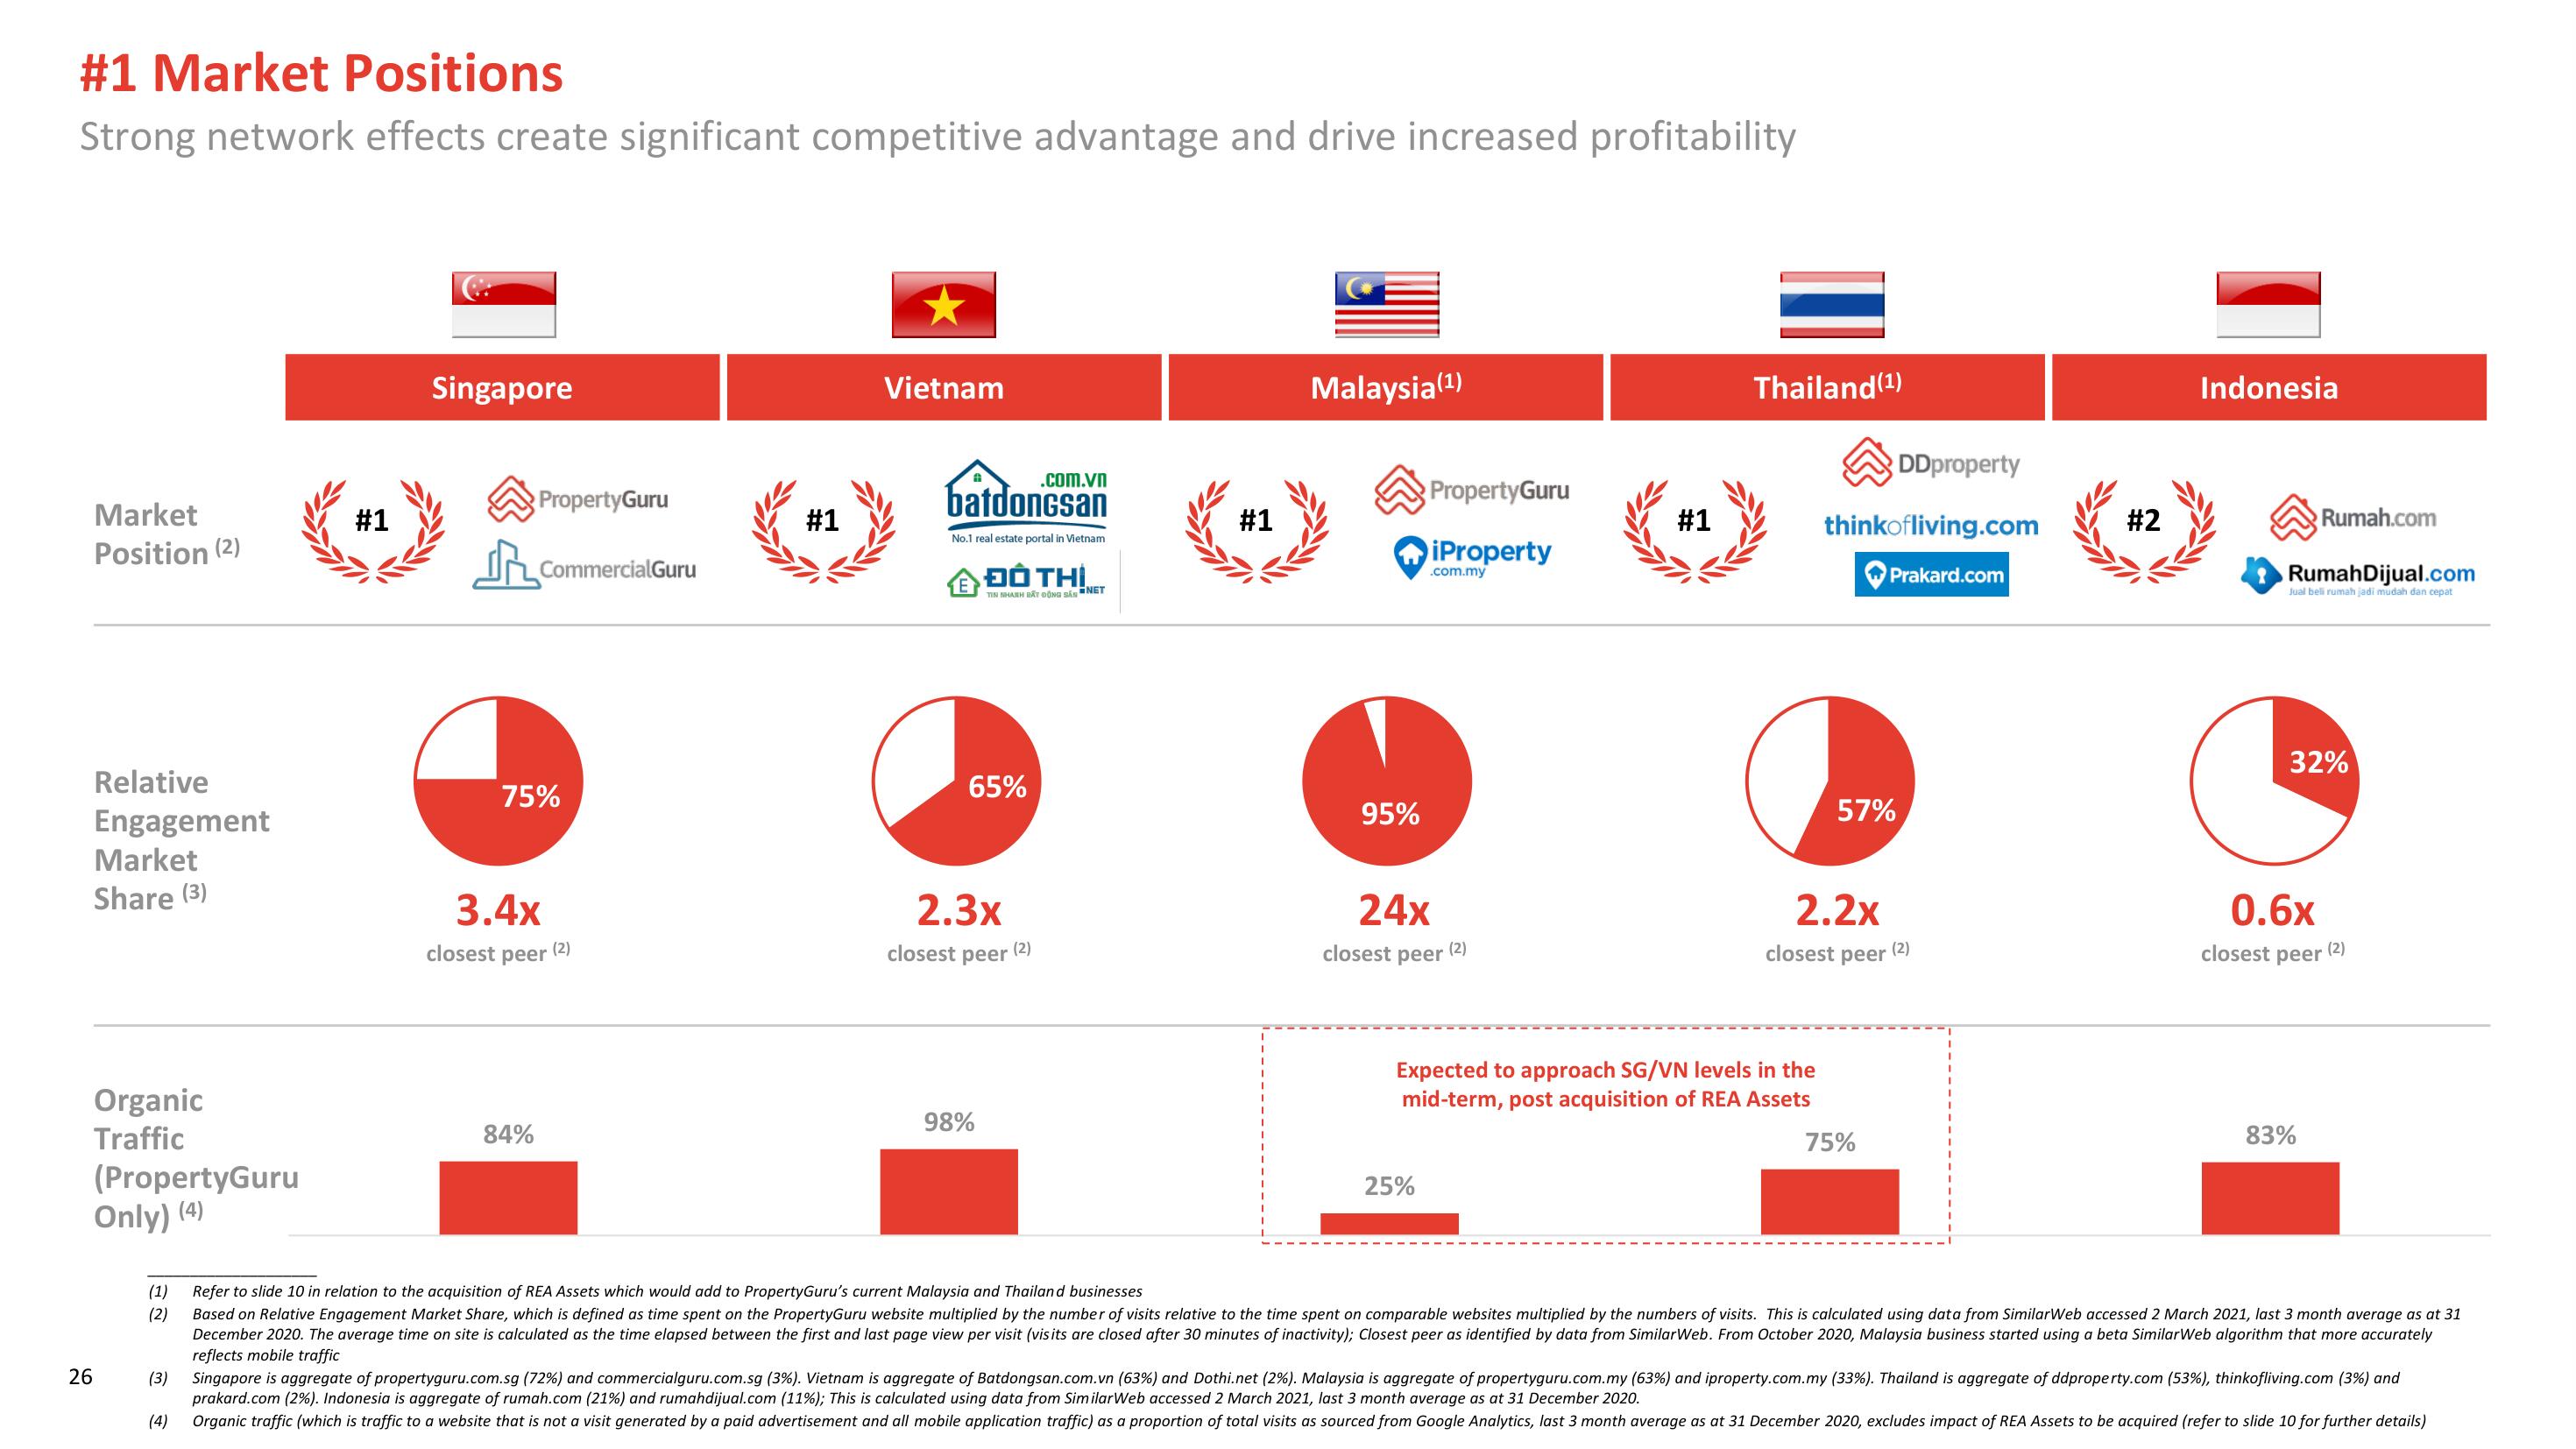
#1 Market Positions
Strong network effects create significant competitive advantage and drive increased profitability
Market
Position (2)
Relative
Engagement
Market
Share (3)
Organic
Traffic
(PropertyGuru
Only) (4)
26
(3)
#1
(4)
Singapore
closest
PropertyGuru
CommercialGuru
75%
3.4x
peer
84%
(2)
#1
Vietnam
.com.vn
batdongsan
No.1 real estate portal in Vietnam
E
DO THI
TIN NHANH BẤT ĐỘNG SẢN NET
65%
2.3x
closest peer
98%
(2)
#1
Malaysia (¹)
95%
PropertyGuru
iProperty
.com.my
24x
closest peer
25%
(2)
#1
Thailand (¹)
Expected to approach SG/VN levels in the
mid-term, post acquisition of REA Assets
DDproperty
thinkofliving.com
Prakard.com
57%
2.2x
closest peer
75%
(2)
#2
Indonesia
Rumah.com
RumahDijual.com
Jual beli rumah jadi mudah dan cepat
32%
0.6x
closest peer
83%
(1) Refer to slide 10 in relation to the acquisition of REA Assets which would add to PropertyGuru's current Malaysia and Thailand businesses
(2) Based on Relative Engagement Market Share, which is defined as time spent on the PropertyGuru website multiplied by the number of visits relative to the time spent on comparable websites multiplied by the numbers of visits. This is calculated using data from SimilarWeb accessed 2 March 2021, last 3 month average as at 31
December 2020. The average time on site is calculated as the time elapsed between the first and last page view per visit (visits are closed after 30 minutes of inactivity); Closest peer as identified by data from SimilarWeb. From October 2020, Malaysia business started using a beta SimilarWeb algorithm that more accurately
reflects mobile traffic
Singapore is aggregate of propertyguru.com.sg (72%) and commercialguru.com.sg (3%). Vietnam is aggregate of Batdongsan.com.vn (63%) and Dothi.net (2%). Malaysia is aggregate of propertyguru.com.my (63%) and iproperty.com.my (33%). Thailand is aggregate of ddproperty.com (53%), thinkofliving.com (3%) and
prakard.com (2%). Indonesia is aggregate of rumah.com (21%) and rumahdijual.com (11%); This is calculated using data from SimilarWeb accessed 2 March 2021, last 3 month average as at 31 December 2020.
Organic traffic (which is traffic to a website that is not a visit generated by a paid advertisement and all mobile application traffic) as a proportion of total visits as sourced from Google Analytics, last 3 month average as at 31 December 2020, excludes impact of REA Assets to be acquired (refer to slide 10 for further details)
(2)View entire presentation