Maersk Investor Presentation Deck
Diversified gateway terminal portfolio
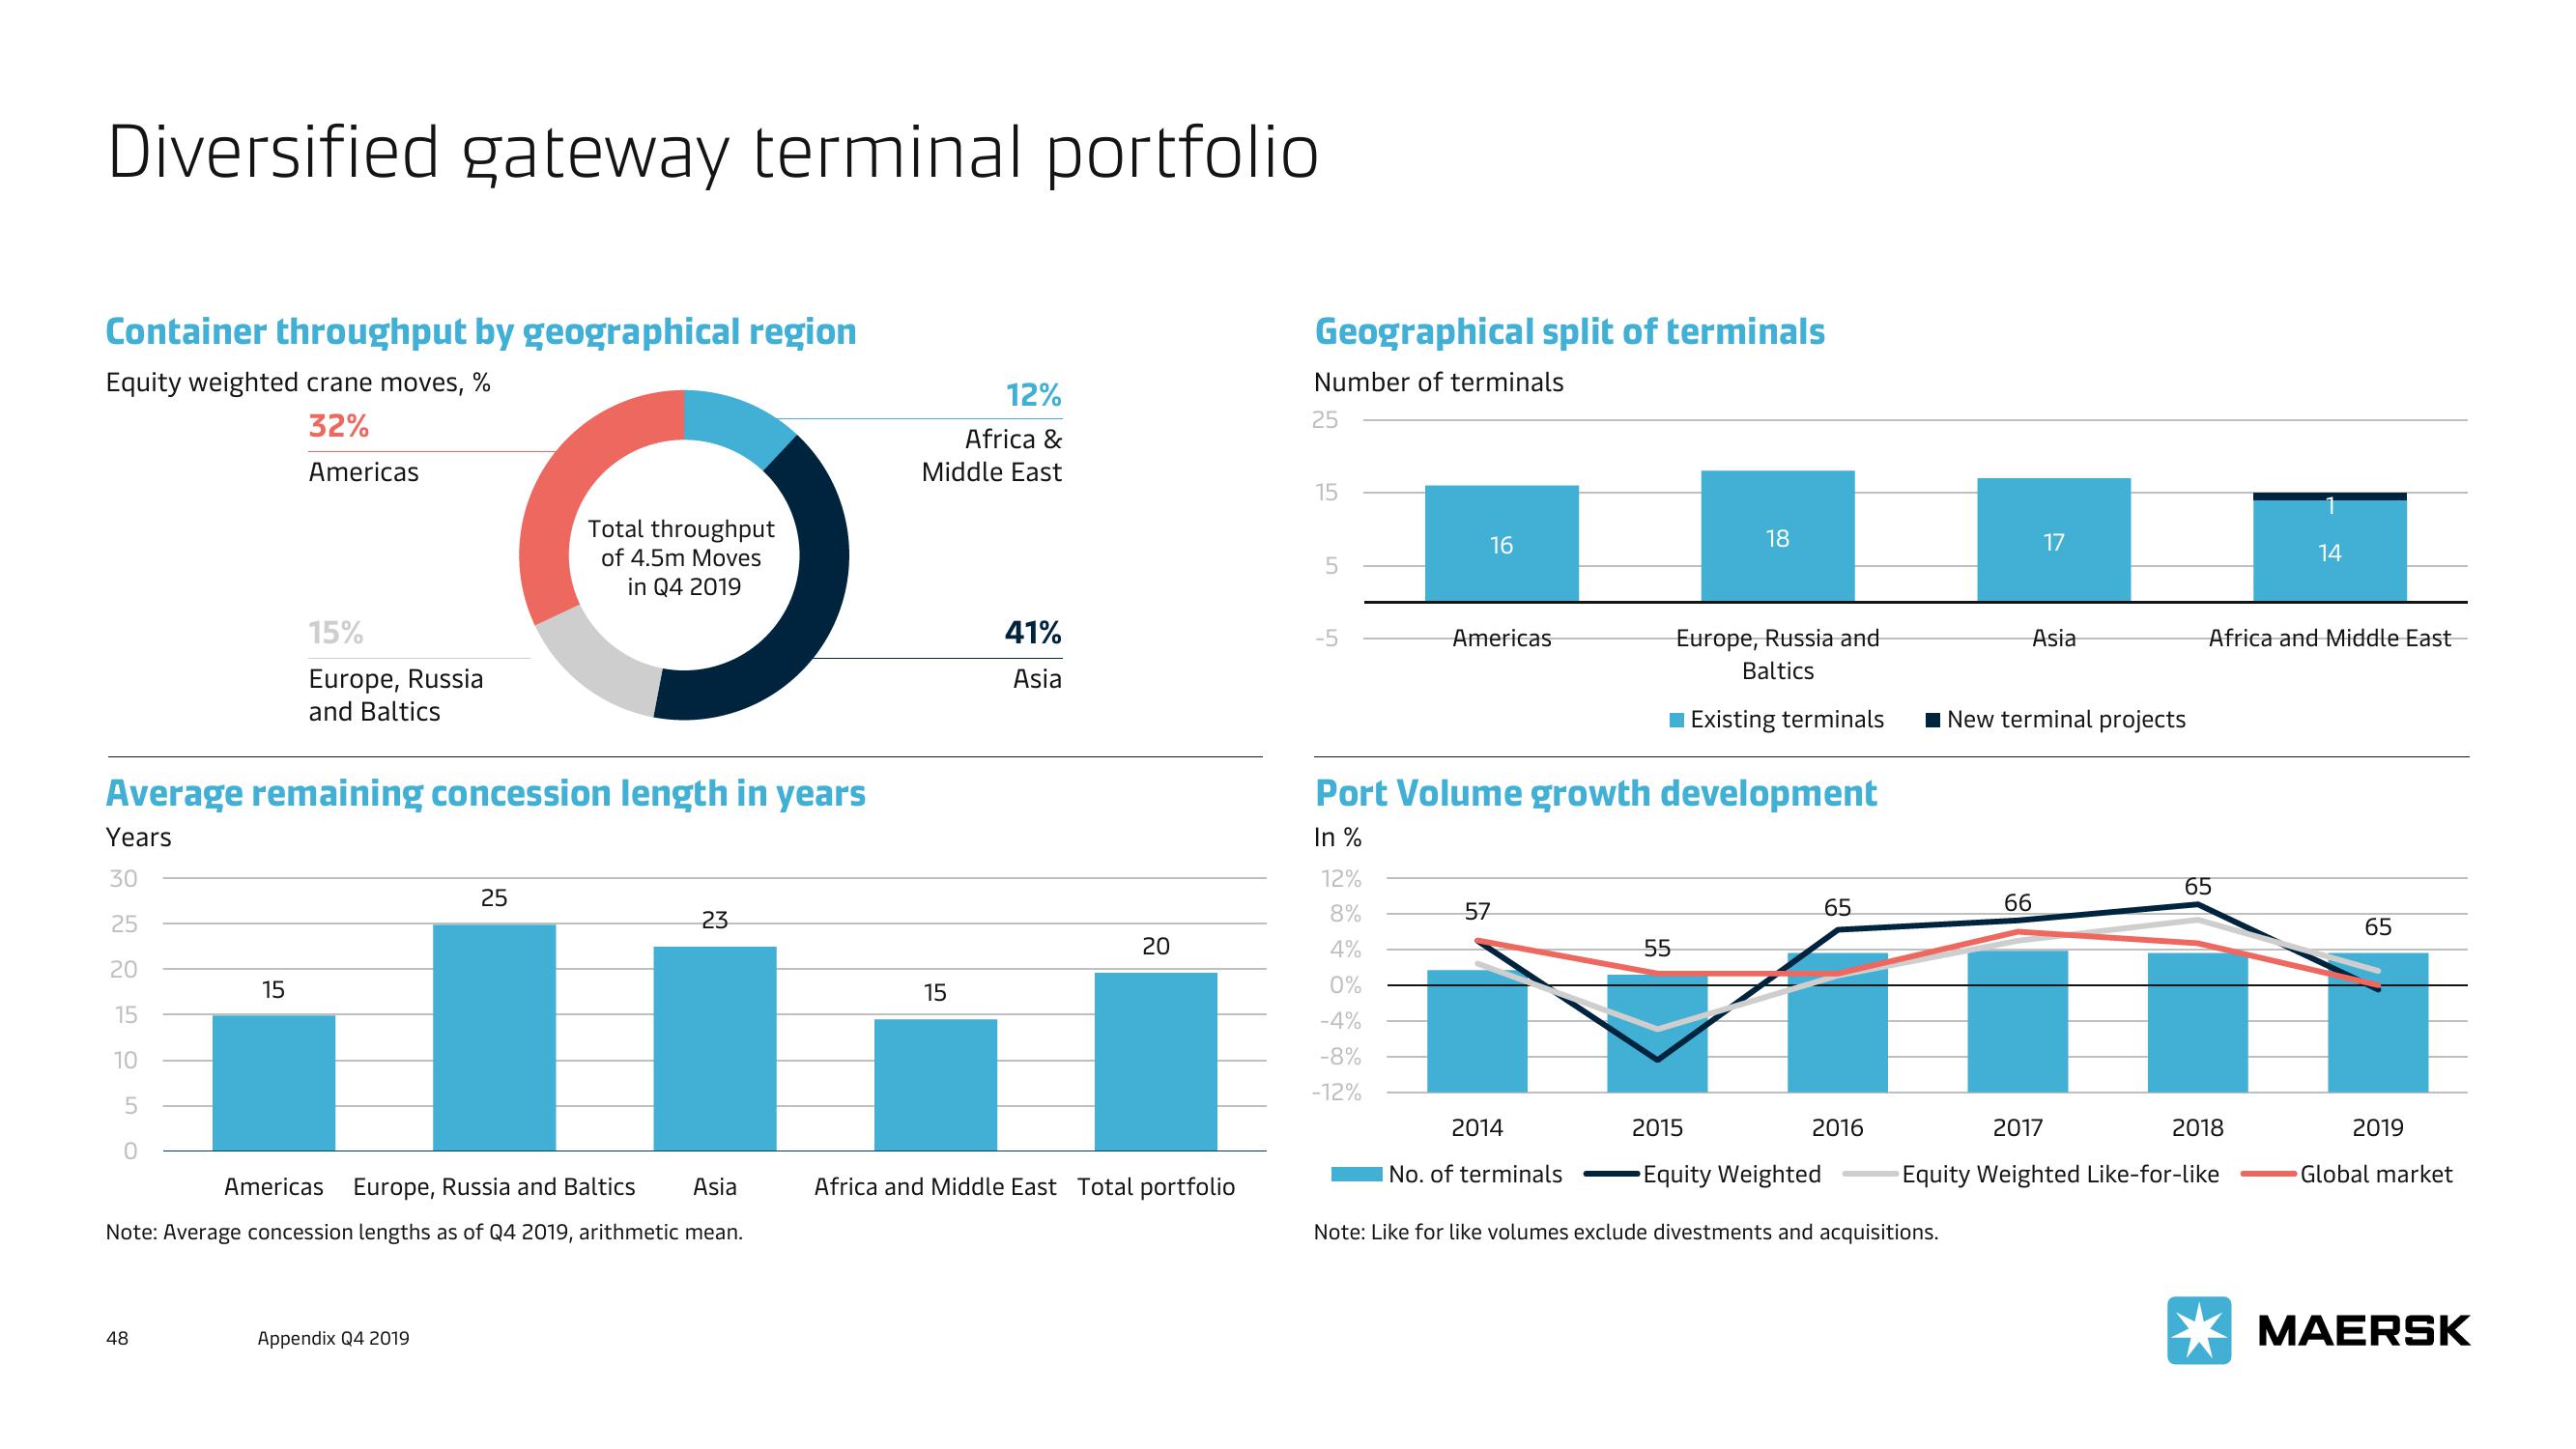
Container throughput by geographical region
Equity weighted crane moves, %
32%
Americas
15 105
Average remaining concession length in years
Years
30
25
20
0
15%
Europe, Russia
and Baltics
15
48
Total throughput
of 4.5m Moves
in Q4 2019
25
Appendix Q4 2019
Americas Europe, Russia and Baltics Asia
Note: Average concession lengths as of Q4 2019, arithmetic mean.
23
12%
Africa &
Middle East
15
41%
Asia
20
Africa and Middle East Total portfolio
Geographical split of terminals
Number of terminals
25
15
5
5
16
12%
8%
4%
0%
-4%
-8%
-12%
Americas
Port Volume growth development
In %
57
2014
18
55
I No. of terminals
Europe, Russia and
Baltics
Existing terminals
65
2015
Equity Weighted
Note: Like for like volumes exclude divestments and acquisitions.
2016
17
■New terminal projects
66
Asia
Africa and Middle East
65
2017
Equity Weighted Like-for-like
2018
14
65
2019
Global market
MAERSKView entire presentation