Getty SPAC Presentation Deck
GAAP vs. Non-GAAP Reconciliation (Cont'd)
Revenue
Gross
Profit
Adj.
EBITDA
($ in mm)
Revenue, Reported
(-) Discontinued Products
Revenue (Excl. Discontinued Products)
Gross Profit, Reported
(-) Discontinued Products
Gross Profit (Excl. Discontinued Products)
% Revenue (Excl. Discontinued Products)
1
1
Net Income / (Loss), Reported
(+) D&A
(+) Interest Expense, net
(+/-) Income Tax Expense / (Benefit)
EBITDA, Reported
(+) Equity-Based Compensation
(+) Restructuring Costs
(+) Gain on Debt Ext. & Modification Expenses
2
(+) Non-Recurring Operating Expenses ²
(+/-) FX Gains/Losses and Other Expenses
1
(-) Discontinued Products
Adj. EBITDA
% Revenue (Excl. Discontinued Products)
3
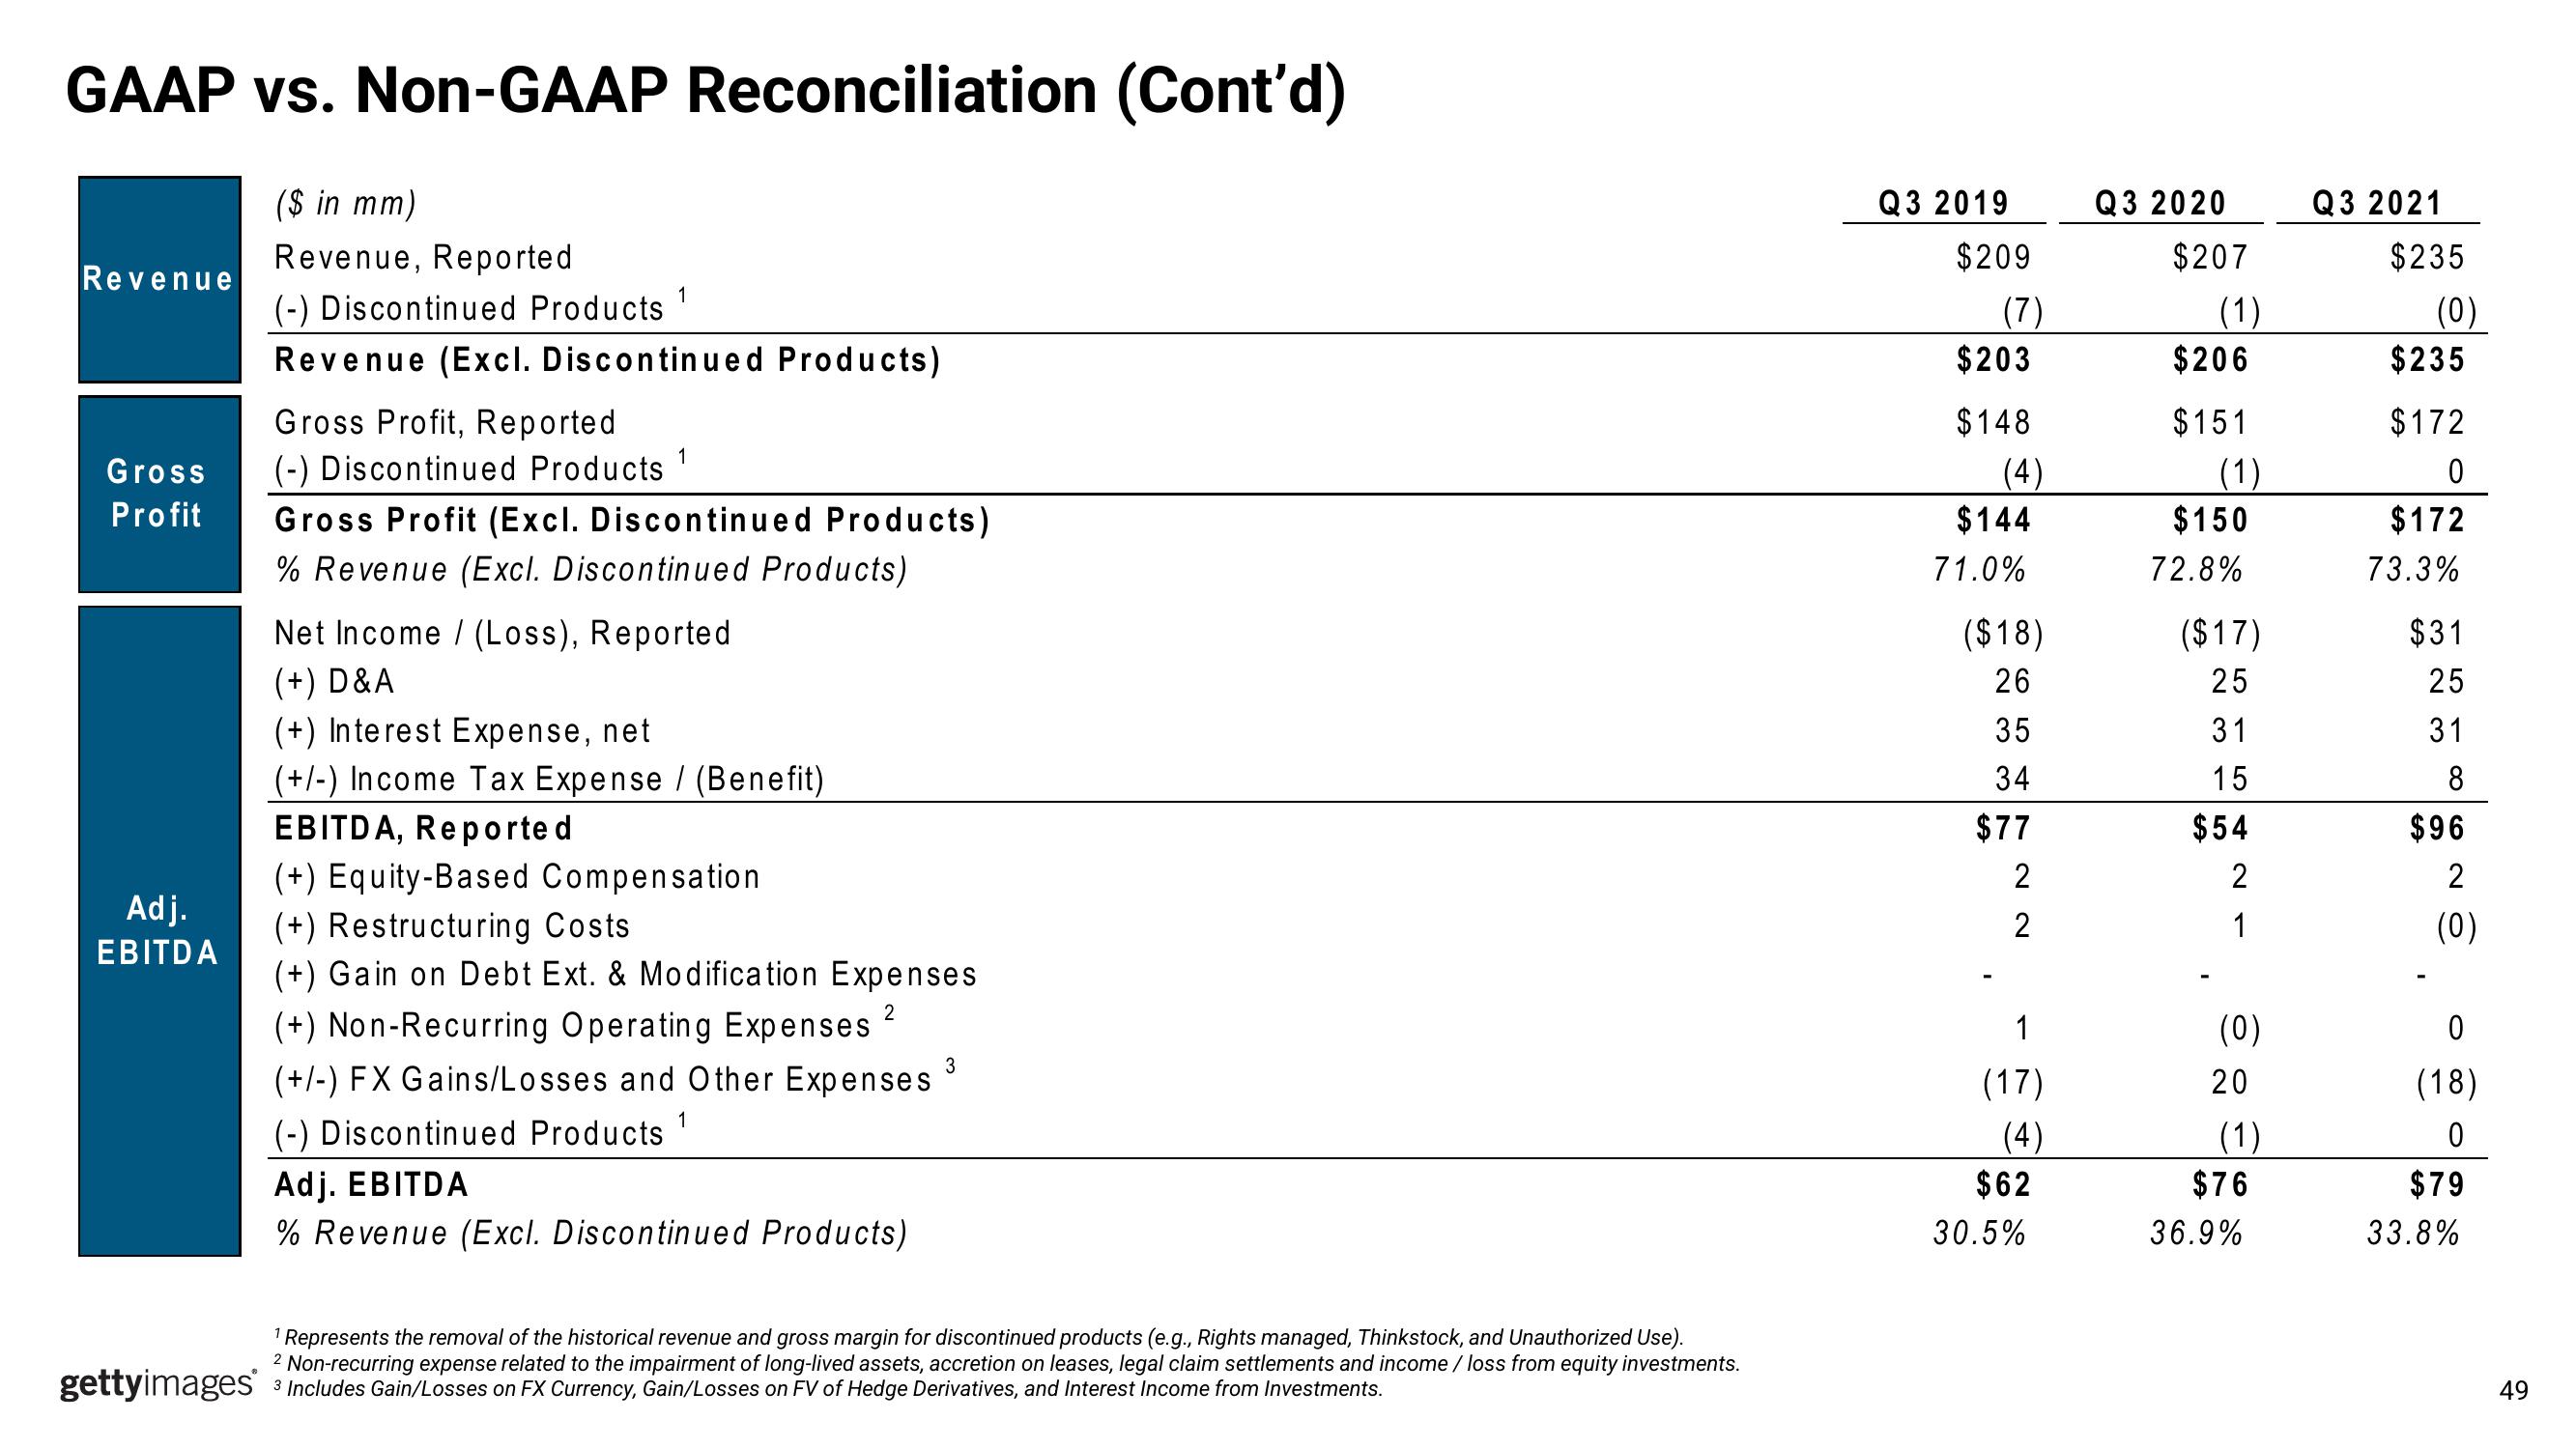
Represents the removal of the historical revenue and gross margin for discontinued products (e.g., Rights managed, Thinkstock, and Unauthorized Use).
2 Non-recurring expense related to the impairment of long-lived assets, accretion on leases, legal claim settlements and income / loss from equity investments.
gettyimages Includes Gain/Losses on FX Currency, Gain/Losses on FV of Hedge Derivatives, and Interest Income from Investments.
Q3 2019
$209
(7)
$203
$148
(4)
$144
71.0%
($18)
26
35
34
$77
2
IN
2
1
(17)
(4)
$62
30.5%
Q3 2020
$207
(1)
$206
$151
(1)
$150
72.8%
($17)
25
31
15
$54
2
1
(0)
20
(1)
$76
36.9%
Q3 2021
$235
(0)
$235
$172
0
$172
73.3%
$31
25
31
8
$96
2
(0)
0
(18)
0
$79
33.8%
49View entire presentation