Carlyle Investor Conference Presentation Deck
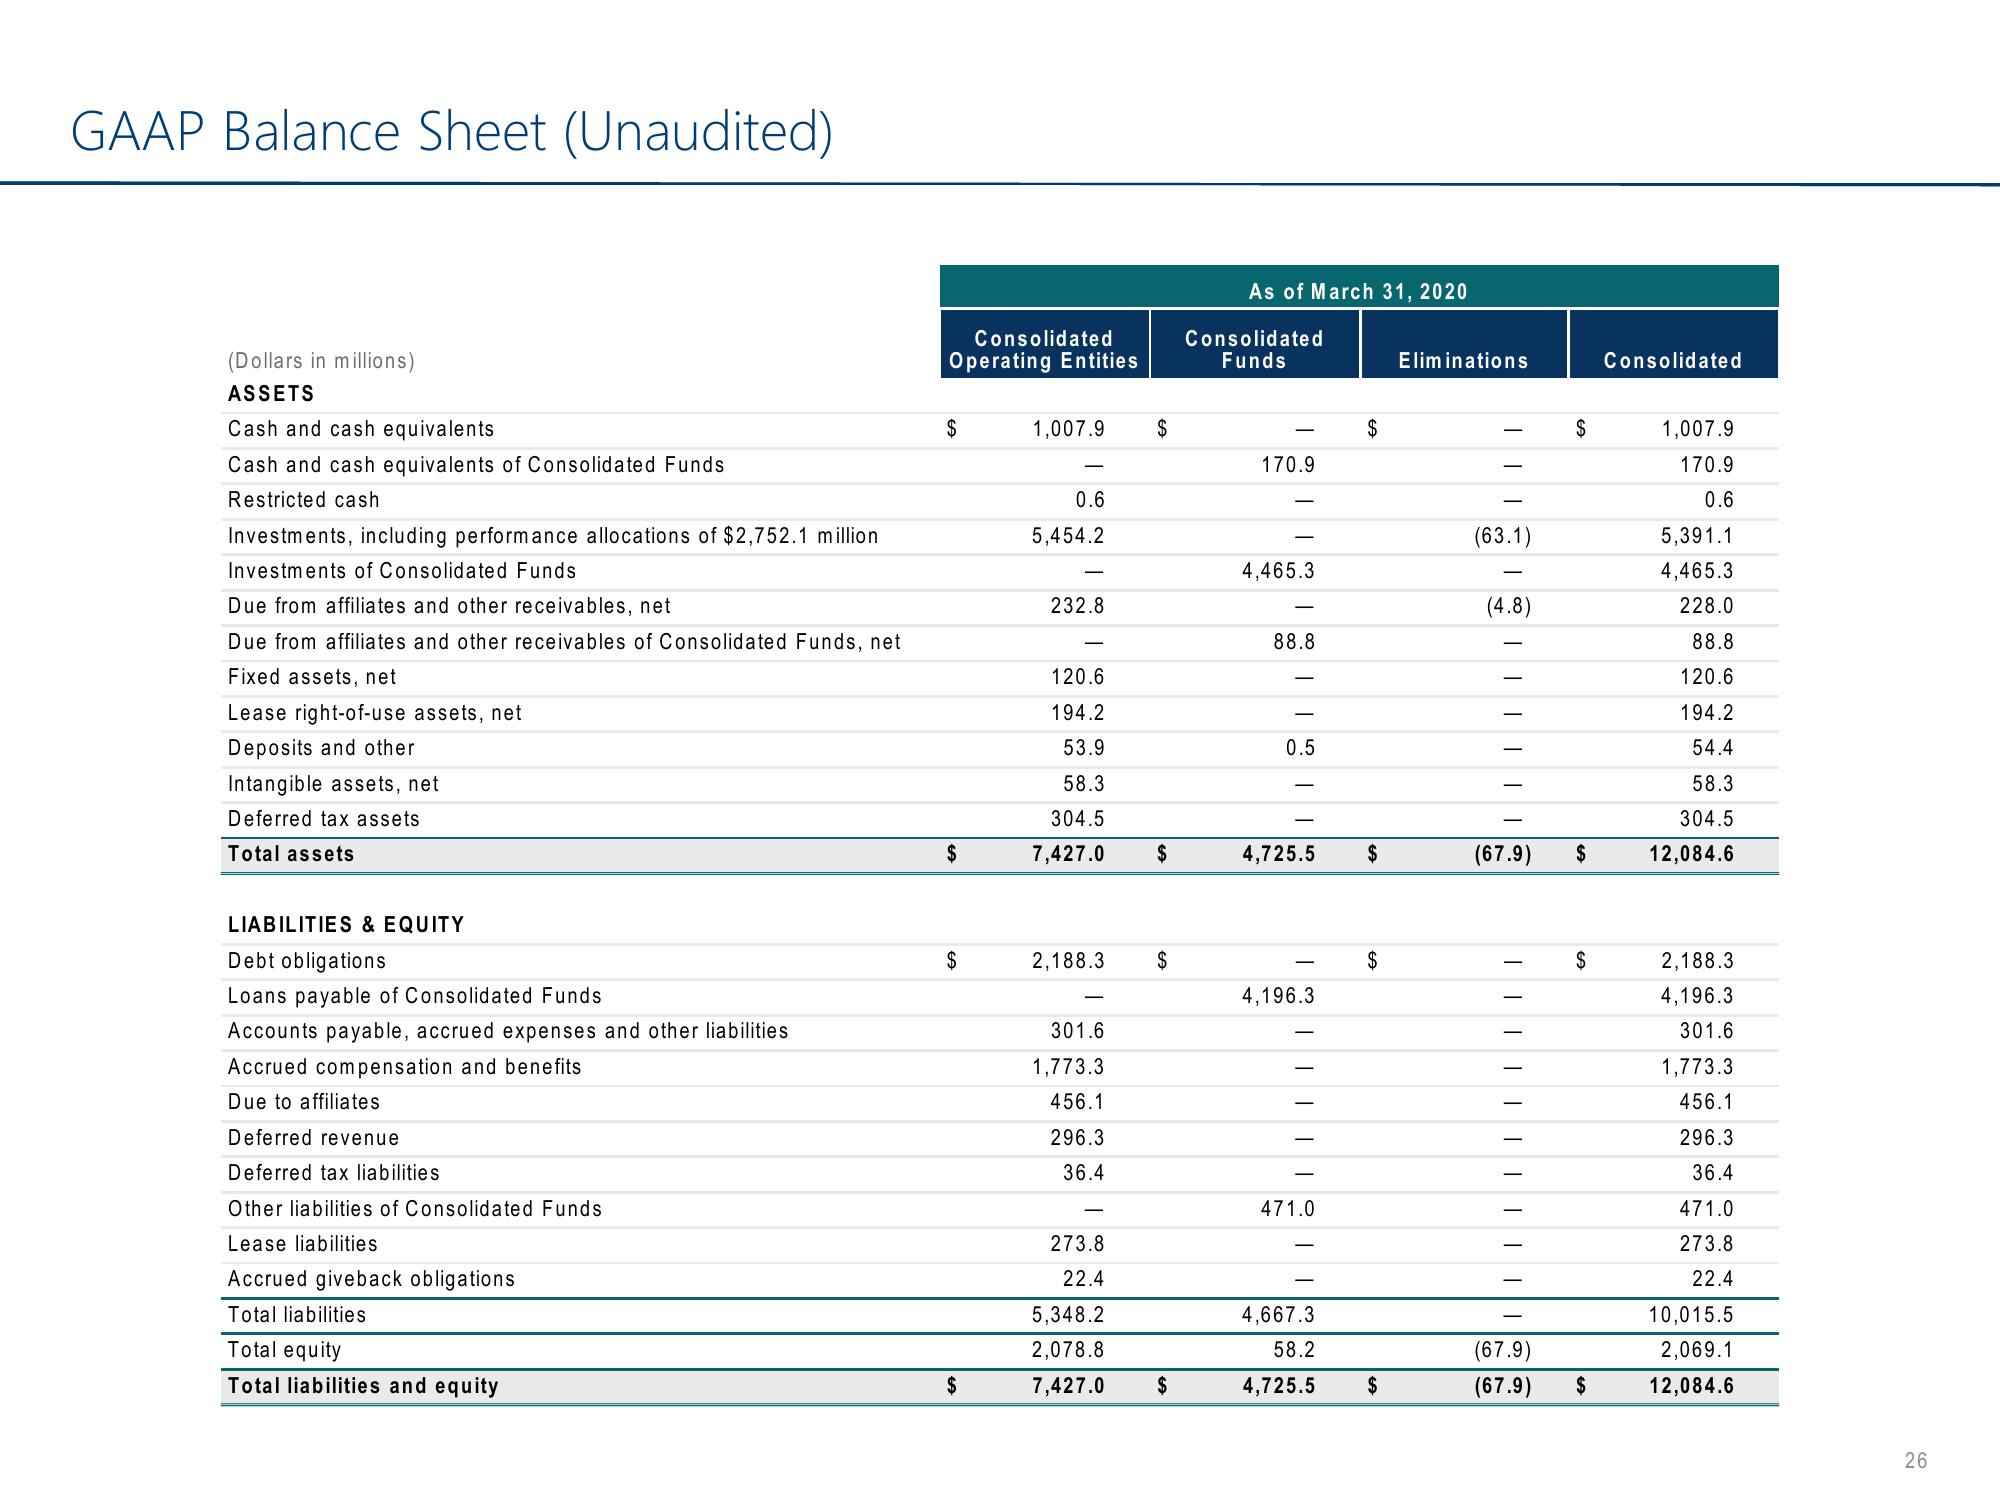
GAAP Balance Sheet (Unaudited)
(Dollars in millions)
ASSETS
Cash and cash equivalents
Cash and cash equivalents of Consolidated Funds
Restricted cash
Investments, including performance allocations of $2,752.1 million
Investments of Consolidated Funds
Due from affiliates and other receivables, net
Due from affiliates and other receivables of Consolidated Funds, net
Fixed assets, net
Lease right-of-use assets, net
Deposits and other
Intangible assets, net
Deferred tax assets.
Total assets
LIABILITIES & EQUITY
Debt obligations
Loans payable of Consolidated Funds
Accounts payable, accrued expenses and other liabilities
Accrued compensation and benefits
Due to affiliates
Deferred revenue
Deferred tax liabilities
Other liabilities of Consolidated Funds
Lease liabilities
Accrued giveback obligations
Total liabilities
Total equity
Total liabilities and equity
Consolidated
Operating Entities
$
$
$
$
1,007.9
-
0.6
5,454.2
232.8
120.6
194.2
53.9
58.3
304.5
7,427.0
301.6
1,773.3
456.1
296.3
36.4
2,188.3 $
-
273.8
22.4
$
5,348.2
2,078.8
7,427.0
$
$
As of March 31, 2020
Consolidated
Funds
170.9
4,465.3
88.8
0.5
4,725.5 $
4,196.3
||||| 9
471.0
$
4,667.3
58.2
4,725.5
$
Eliminations
(63.1)
(4.8)
| | | | |
(67.9)
(67.9)
(67.9)
$
$
$
$
Consolidated
1,007.9
170.9
0.6
5,391.1
4,465.3
228.0
88.8
120.6
194.2
54.4
58.3
304.5
12,084.6
2,188.3
4,196.3
301.6
1,773.3
456.1
296.3
36.4
471.0
273.8
22.4
10,015.5
2,069.1
12,084.6
26View entire presentation