Antero Midstream Partners Investor Presentation Deck
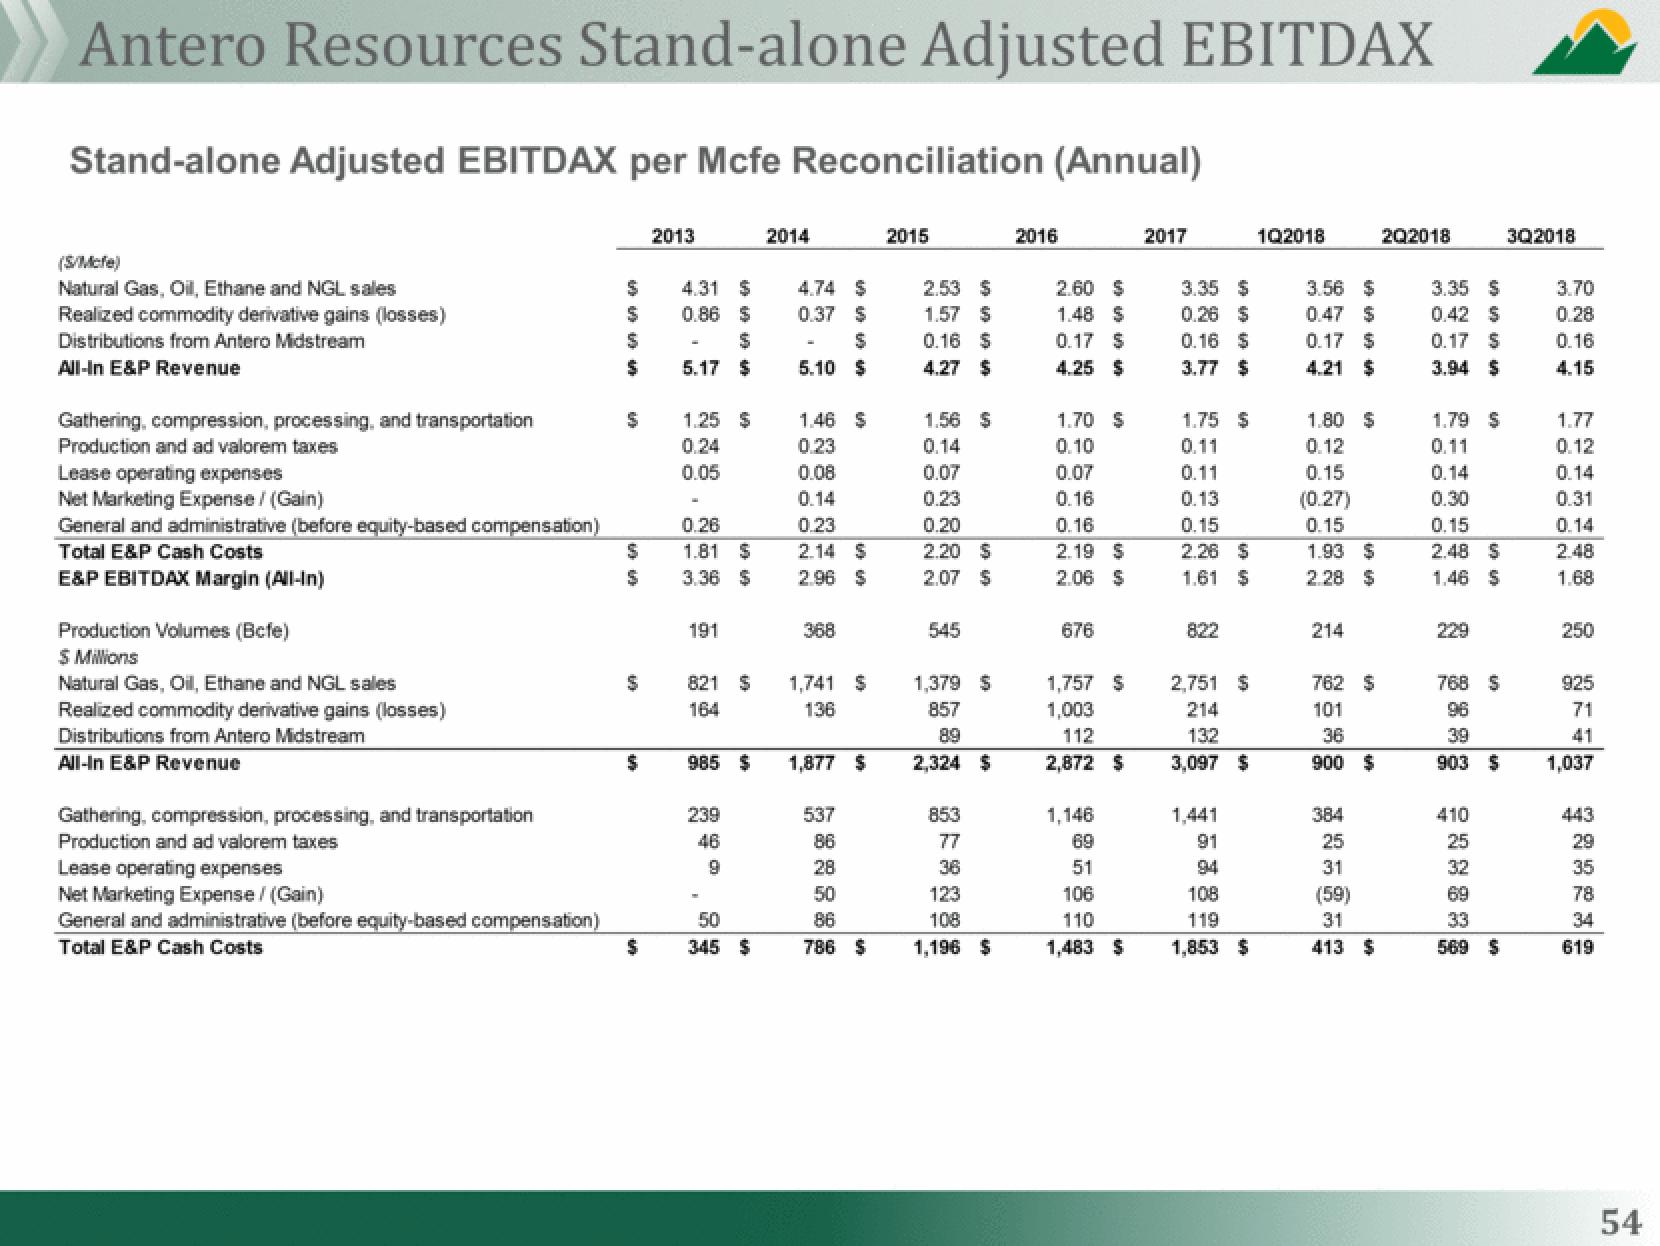
Antero Resources Stand-alone Adjusted EBITDAX
Stand-alone Adjusted EBITDAX per Mcfe Reconciliation (Annual)
(S/Mcfe)
Natural Gas, Oil, Ethane and NGL sales
Realized commodity derivative gains (losses)
Distributions from Antero Midstream
All-In E&P Revenue
Gathering, compression, processing, and transportation
Production and ad valorem taxes
Lease operating expenses
Net Marketing Expense/ (Gain)
General and administrative (before equity-based compensation)
Total E&P Cash Costs
E&P EBITDAX Margin (All-In)
Production Volumes (Bcfe)
$ Millions
Natural Gas, Oil, Ethane and NGL sales
Realized commodity derivative gains (losses)
Distributions from Antero Midstream
All-In E&P Revenue
Gathering, compression, processing, and transportation
Production and ad valorem taxes
Lease operating expenses
Net Marketing Expense / (Gain)
General and administrative (before equity-based compensation)
Total E&P Cash Costs
$
$
$
$
$
$
$
$
$
$
2013
4.31 $ 4.74 $
0.86 $
0.37 S
$
5.10 $
00 00
5.17 $
$
1.25 $
0.24
0.05
191
0.26
1.81 S
3.36 $
821 $
164
239
46
9
985 $
2014
50
345 $
1.46 $
0.23
0.08
0.14
0.23
2.14 $
2.96 $
368
1,741 $
136
1,877 $
537
86
28
50
86
786 $
2015
2.53 $
1.57 $
0.16 $
4.27 $
1.56 $
0.14
0.07
0.23
0.20
2.20
2.07
545
$
S
1,379 $
857
89
2,324 $
853
77
36
123
108
1,196 $
2016
2.60 $
1.48 S
0.17 S
4.25 $
1.70 S
0.10
0.07
0.16
0.16
2.19 S
2.06 $
676
1,757 S
1,003
112
2,872 $
1,146
69
51
106
110
1,483 $
2017
3.35 $
0.26 $
0.16 S
3.77 $
1.75 $
0.11
0.11
0.13
0.15
2.26 S
1.61 $
822
2,751 $
214
132
3,097 $
1,441
91
94
108
119
1,853 $
1Q2018
3.56 $
0.47 $
0.17 $
4.21 $
1.80 $
0.12
0.15
(0.27)
0.15
1.93 $
2.28 $
214
762 S
101
36
900 $
384
25
31
(59)
31
413 S
202018
3.35 S
0.42 S
0.17 S
3.94 $
1.79 $
0.11
0.14
0.30
0.15
2.48 S
1.46 S
229
768 S
39
903 S
410
25
32
69
33
569 S
3Q2018
3.70
0.28
0.16
4.15
1.77
0.12
0.14
0.31
0.14
2.48
1.68
250
925
71
41
1,037
29
35
78
34
619
54View entire presentation