Vivid Seats Investor Presentation Deck
Vivid Seats Financial Highlights
Growth at Scale
Profitability
Cash Flow
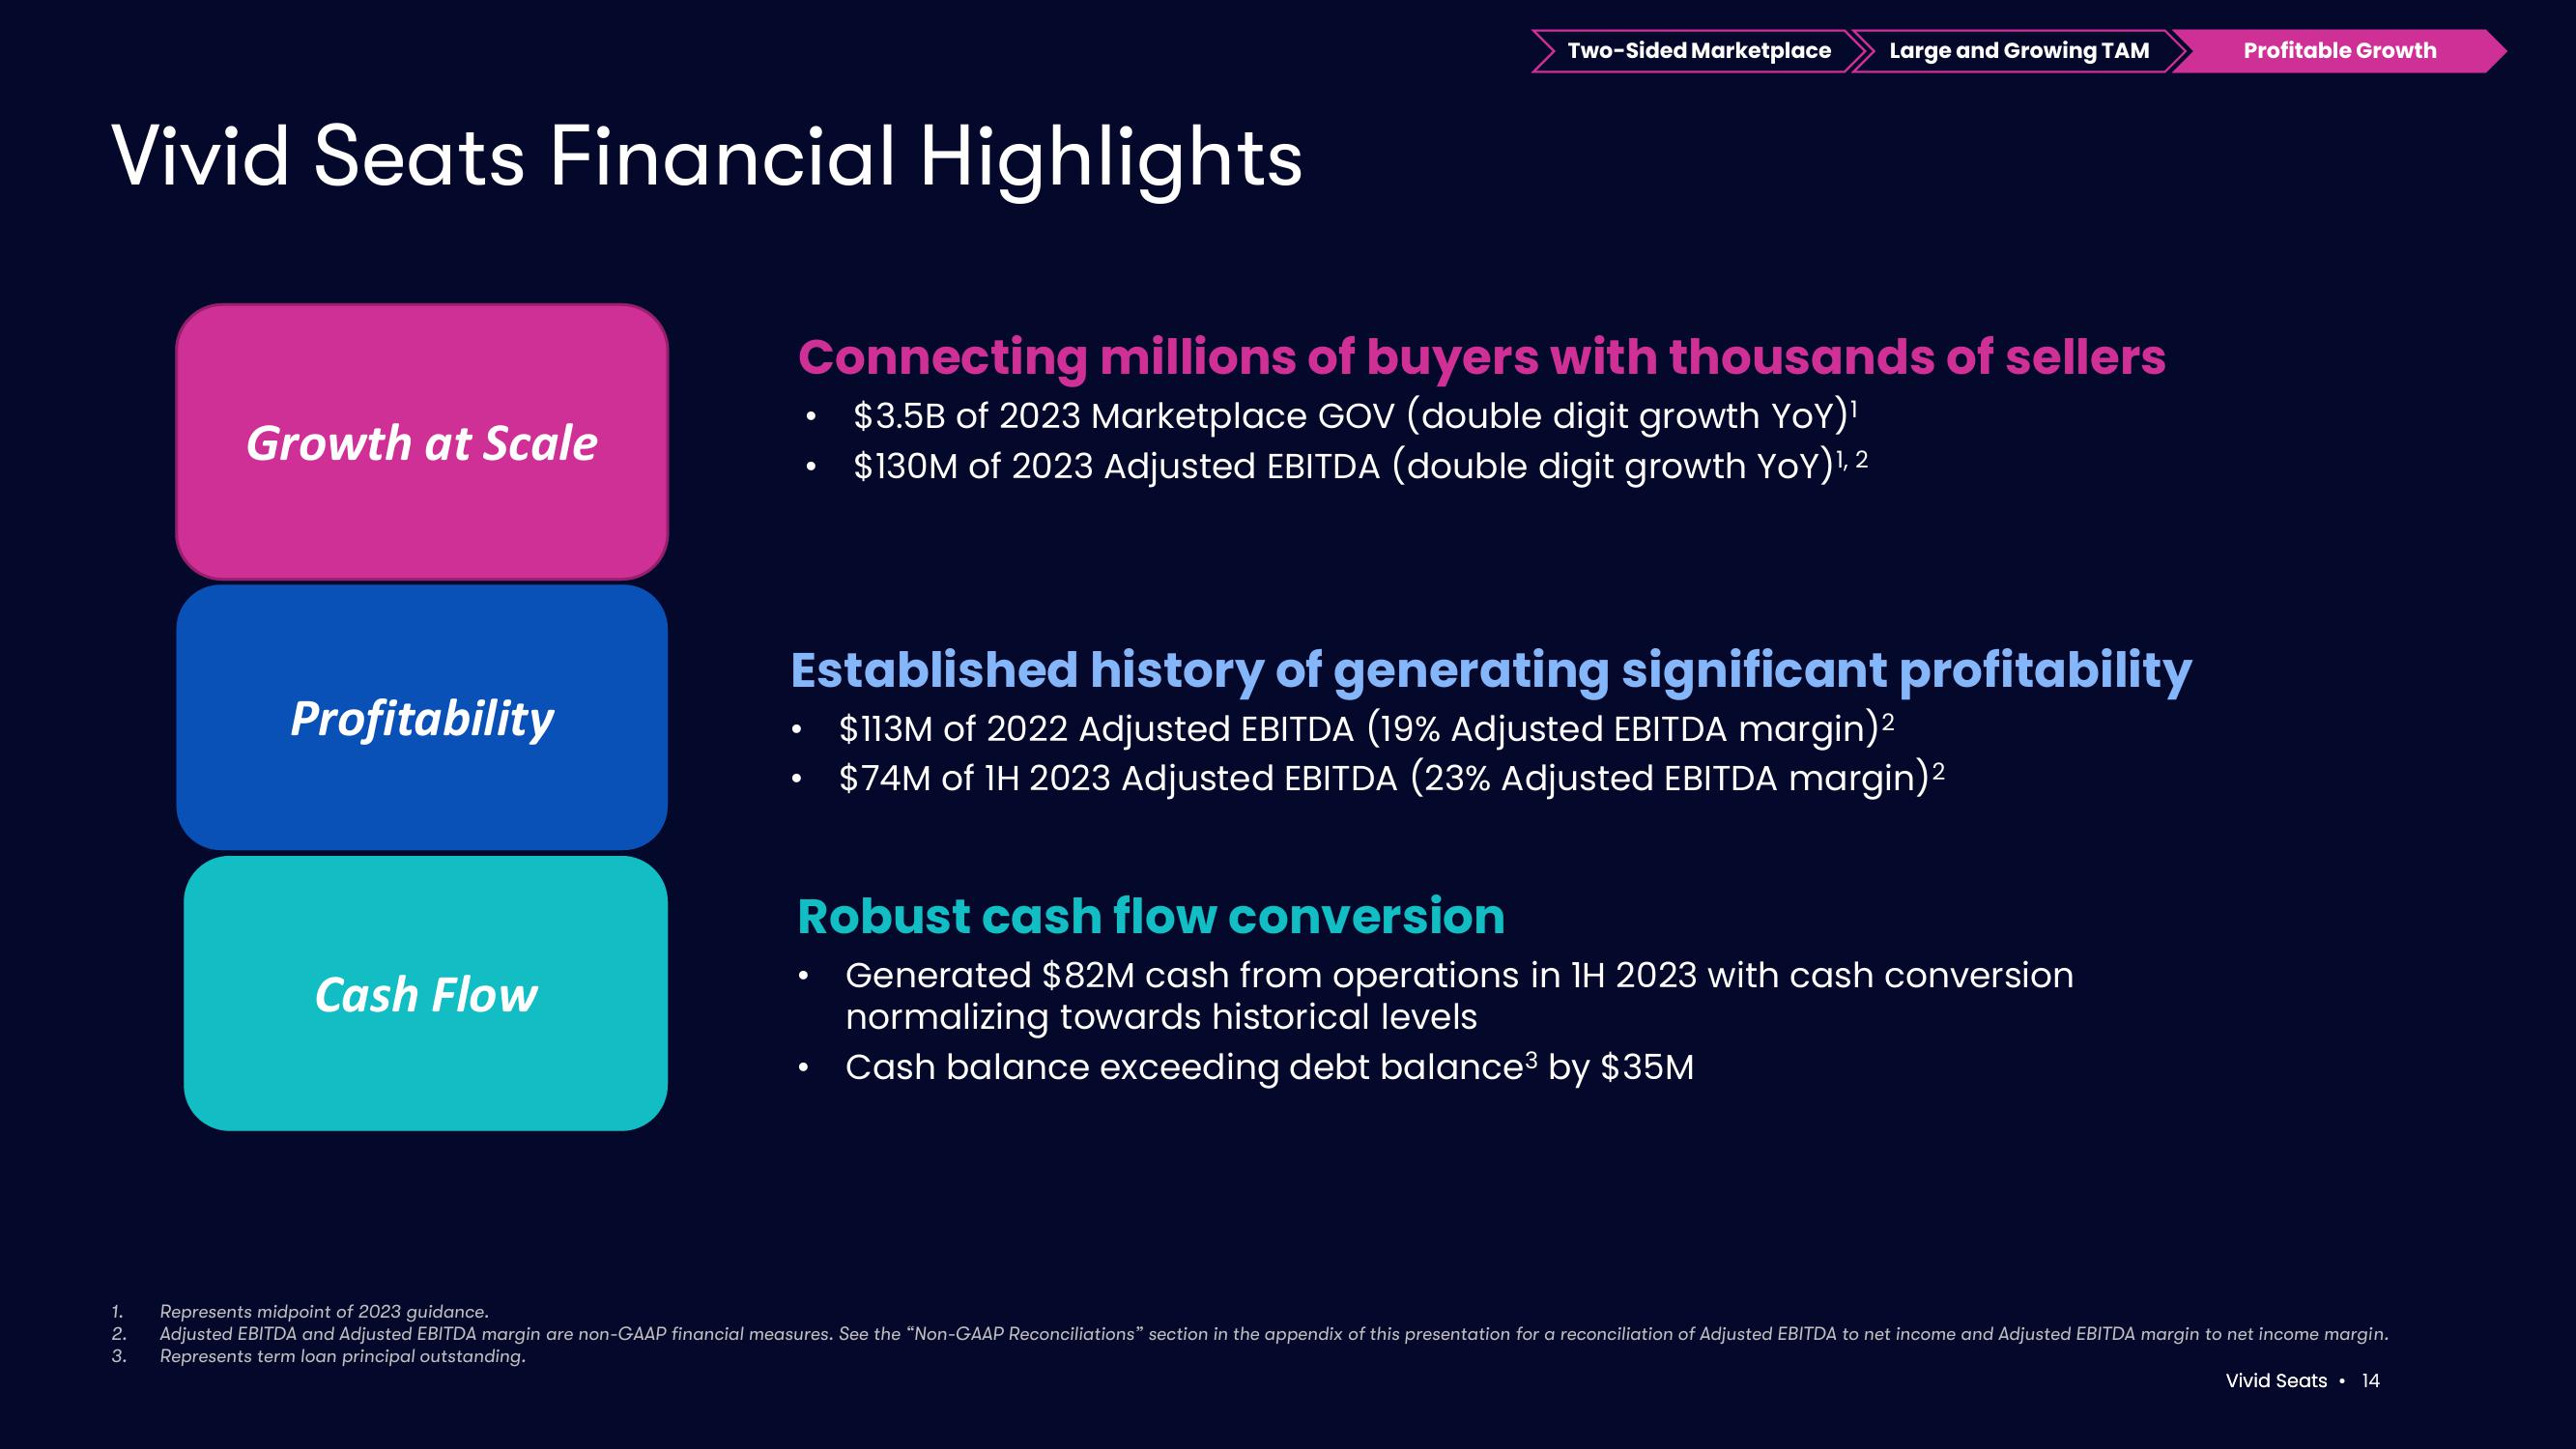
Connecting millions of buyers with thousands of sellers
$3.5B of 2023 Marketplace GOV (double digit growth YoY)¹
$130M of 2023 Adjusted EBITDA (double digit growth YoY)¹, 2
●
●
Two-Sided Marketplace Large and Growing TAM
●
Established history of generating significant profitability
$113M of 2022 Adjusted EBITDA (19% Adjusted EBITDA margin)²
• $74M of 1H 2023 Adjusted EBITDA (23% Adjusted EBITDA margin)2
Robust cash flow conversion
Generated $82M cash from operations in 1H 2023 with cash conversion
normalizing towards historical levels
Cash balance exceeding debt balance³ by $35M
Profitable Growth
1. Represents midpoint of 2023 guidance.
2.
Adjusted EBITDA and Adjusted EBITDA margin are non-GAAP financial measures. See the "Non-GAAP Reconciliations" section in the appendix of this presentation for a reconciliation of Adjusted EBITDA to net income and Adjusted EBITDA margin to net income margin.
Represents term loan principal outstanding.
3.
Vivid Seats 14View entire presentation