Masterworks Investor Presentation Deck
Index (1995= 1)
Historical Performance Over Time
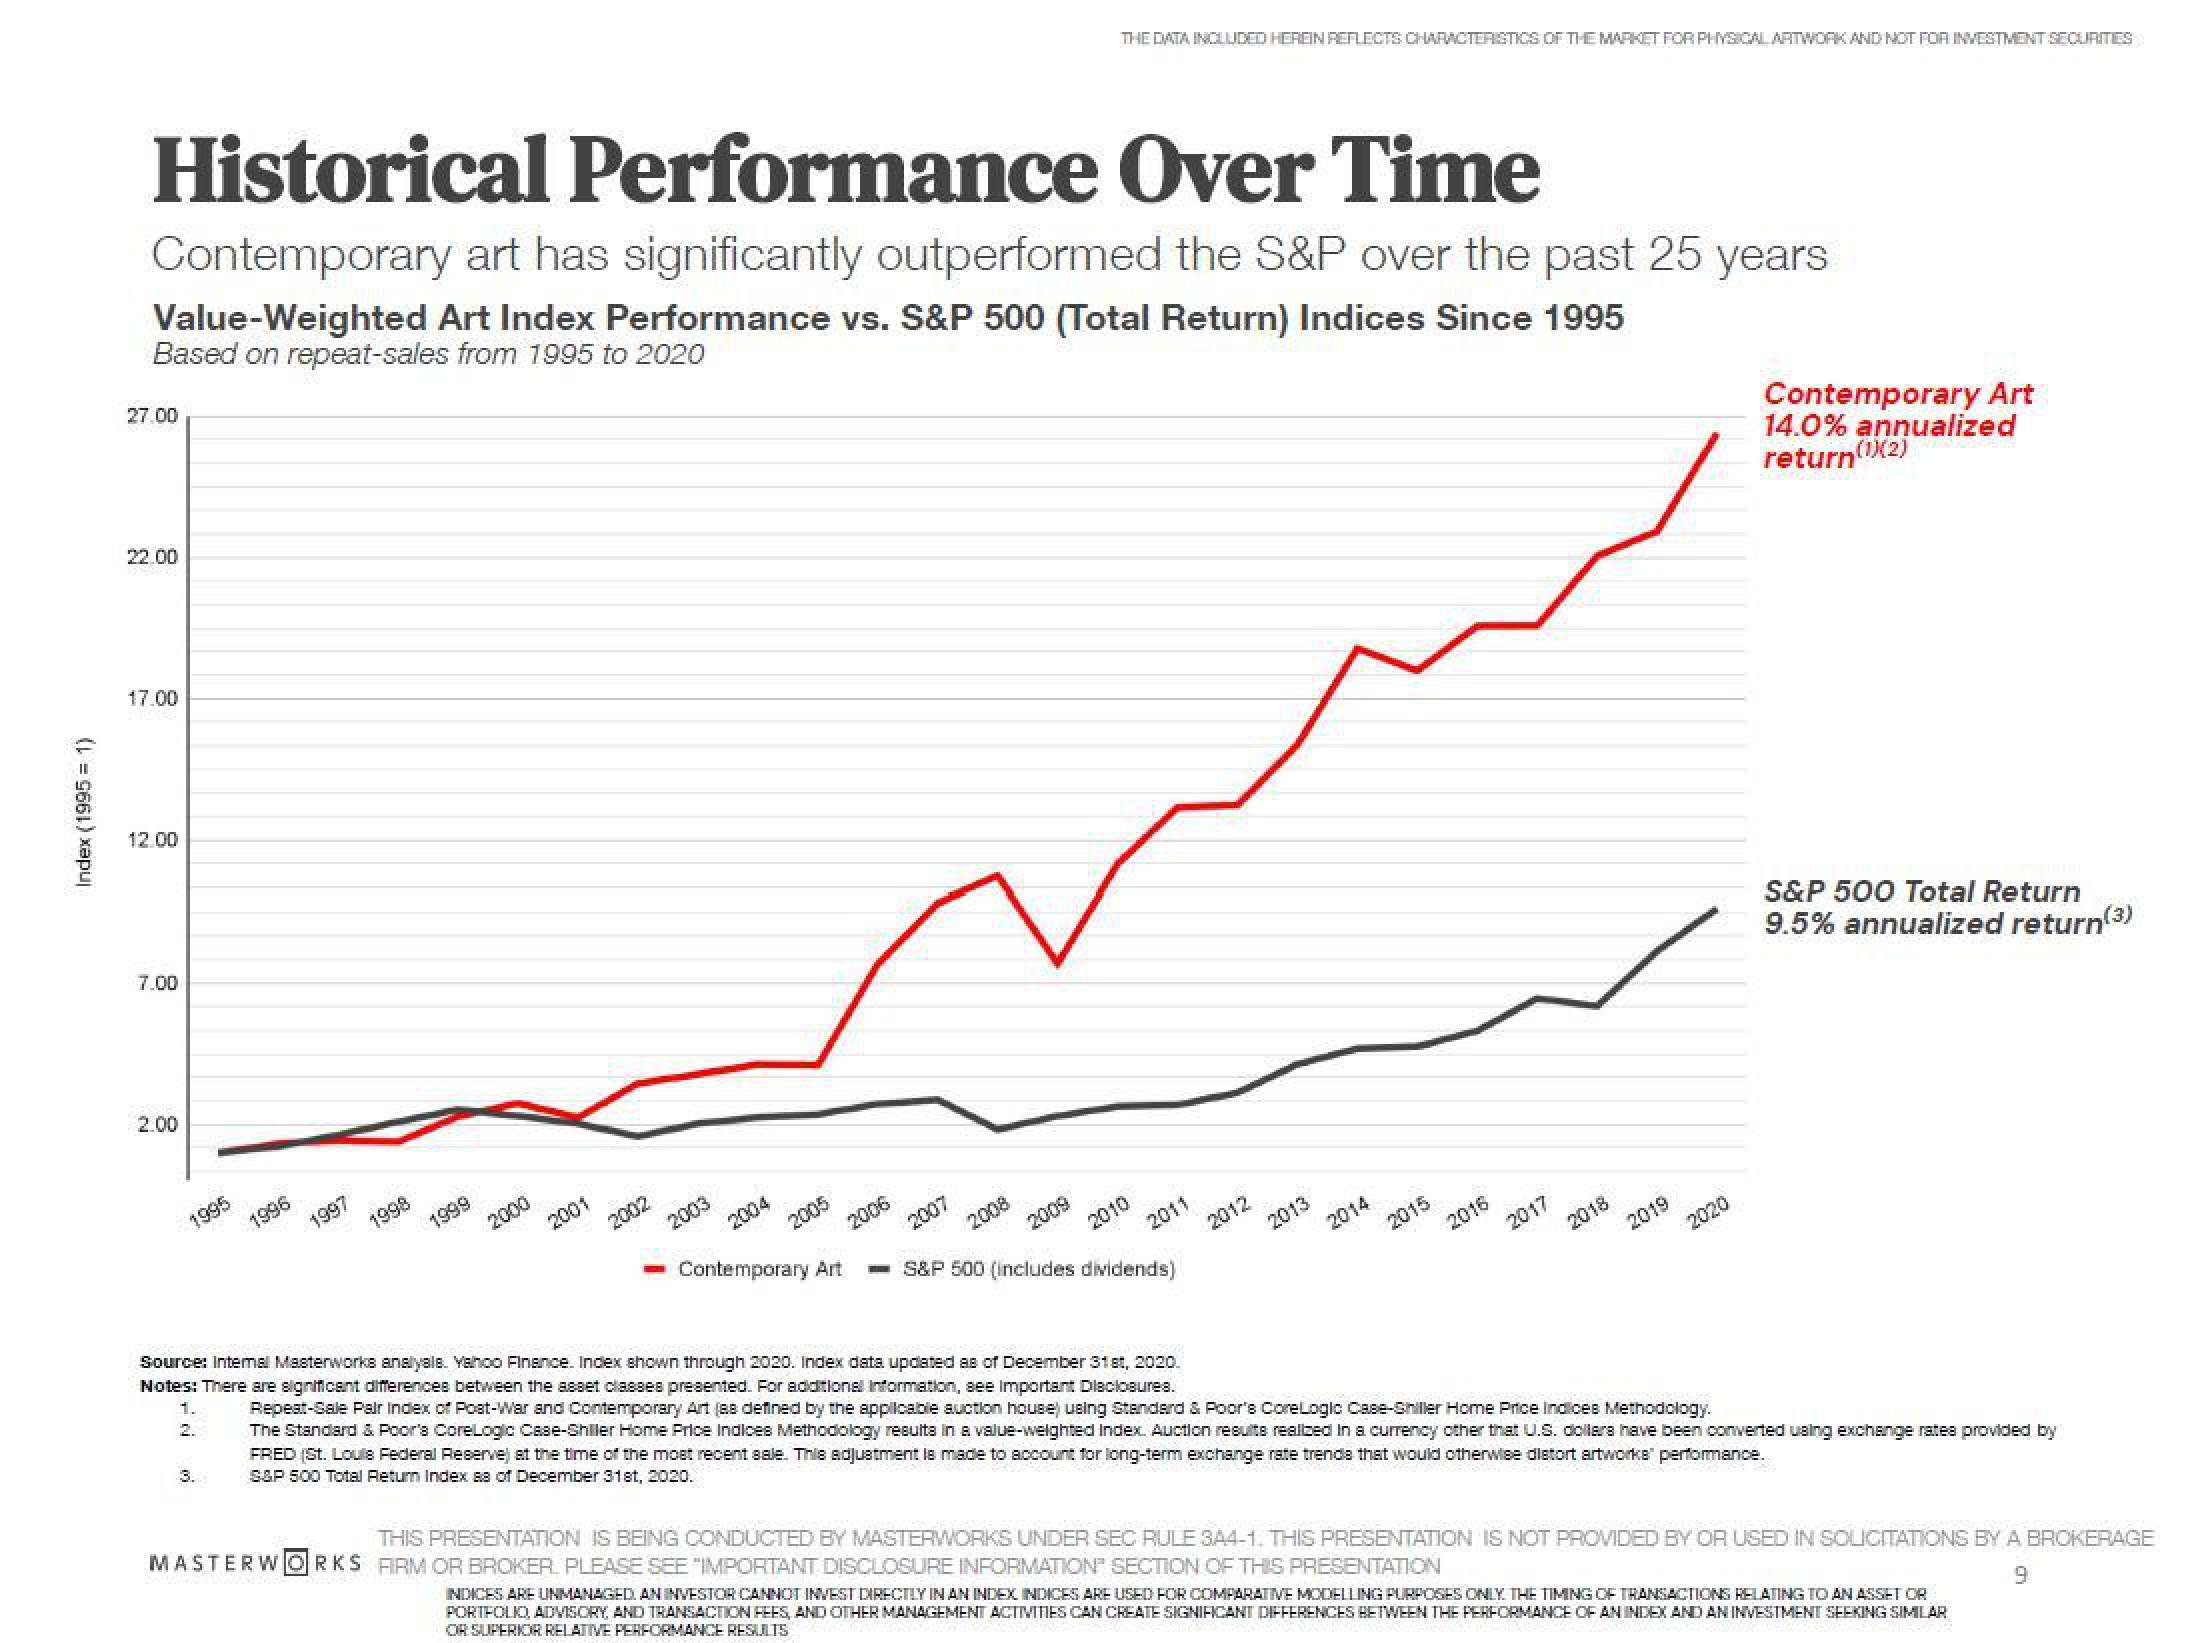
Contemporary art has significantly outperformed the S&P over the past 25 years
Value-Weighted Art Index Performance vs. S&P 500 (Total Return) Indices Since 1995
Based on repeat-sales from 1995 to 2020
27.00
22.00
17.00
12.00
7.00
2.00
1995
1996
3.
1997
1998
1999
2002
2003
Contemporary Art
2006
2007
2008
THE DATA INCLUDED HEREIN REFLECTS CHARACTERISTICS OF THE MARKET FOR PHYSICAL ARTWORK AND NOT FOR INVESTMENT SECURITIES
2009
2011
S&P 500 (includes dividends)
2012
2013
2014
2015
2016
2017
2018
2019
2020
Contemporary Art
14.0% annualized
return(¹)(2)
S&P 500 Total Return
9.5% annualized return(3)
1.
Source: Internal Masterworks analyals. Yahoo Finance. Index shown through 2020. Index data updated as of December 31st, 2020.
Notes: There are significant differences between the asset classes presented. For additional Information, see Important Disclosures.
Repeat-Sale Pair Index of Post-War and Contemporary Art (as defined by the applicable auction house) using Standard & Poor's CoreLogic Case-Shiller Home Price Indices Methodology.
The Standard & Poor's CoreLogic Case-Shiller Home Price Indices Methodology results in a value-weighted Index. Auction results realized in a currency other that U.S. dollars have been converted using exchange rates provided by
FRED (St. Louis Federal Reserve) at the time of the most recent sale. This adjustment is made to account for long-term exchange rate trends that would otherwise distort artworks performance.
S&P 500 Total Return Index as of December 31st, 2020.
THIS PRESENTATION IS BEING CONDUCTED BY MASTERWORKS UNDER SEC RULE 3A4-1. THIS PRESENTATION IS NOT PROVIDED BY OR USED IN SOLICITATIONS BY A BROKERAGE
MASTERWORKS FIRM OR BROKER. PLEASE SEE "IMPORTANT DISCLOSURE INFORMATION" SECTION OF THIS PRESENTATION
9
INDICES ARE UNMANAGED AN INVESTOR CANNOT INVEST DIRECTLY IN AN INDEX INDICES ARE USED FOR COMPARATIVE MODELLING PURPOSES ONLY THE TIMING OF TRANSACTIONS RELATING TO AN ASSET OR
PORTFOLIO, ADVISORY, AND TRANSACTION FEES, AND OTHER MANAGEMENT ACTIVITIES CAN CREATE SIGNIFICANT DIFFERENCES BETWEEN THE PERFORMANCE OF AN INDEX AND AN INVESTMENT SEEKING SIMILAR
OR SUPERIOR RELATIVE PERFORMANCE RESULTSView entire presentation