Credit Suisse Investment Banking Pitch Book
CONFIDENTIAL
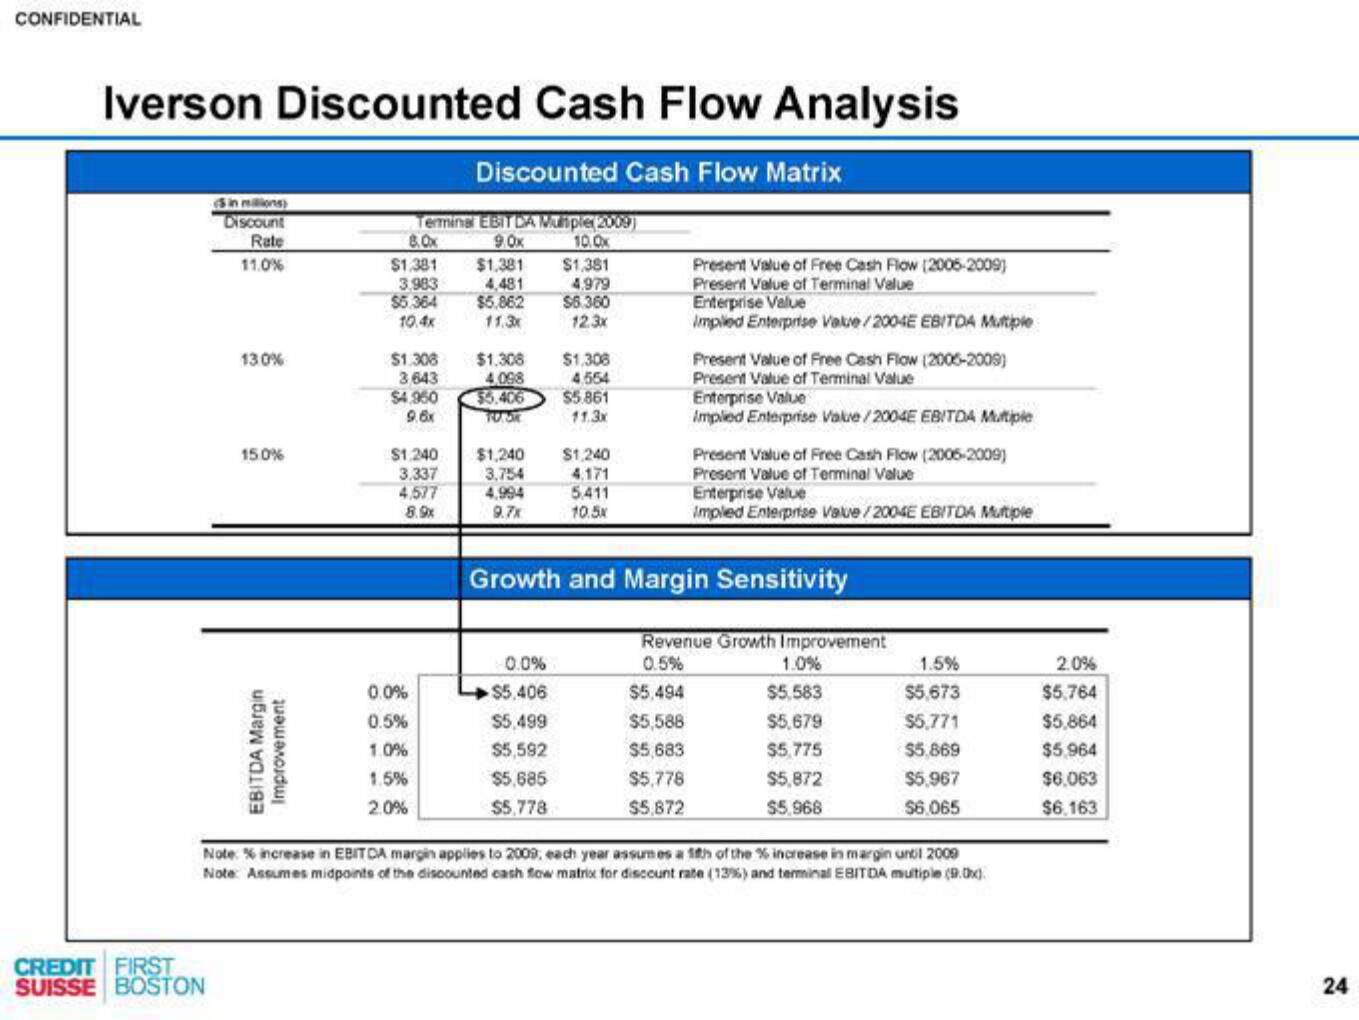
Iverson Discounted Cash Flow Analysis
Discounted Cash Flow Matrix
Sin millions)
Discount
Rate
11.0%
CREDIT FIRST
SUISSE BOSTON
130%
15.0%
EBITDA Margin
Improvement
Terminal EBITDA Multiple(2009)
8.0x
9.0x
10.0x
$1.381
3.983
$5.364
10.4x
$1.308
3,643
$4.960
9.6x
$1,240
3.337
4,577
8.9x
0.0%
0.5%
1.0%
1.5%
2.0%
$1,381
4,481
$5,862
11.3x
$1.308
$1,308
4,098
4.554
$5.406 $5.861
TOROK
11.3x
$1,381
4.979
$6.360
12.3x
$1,240 $1,240
3,754
4.171
5.411
1051
9.7x
0.0%
$5,406
$5,499
$5,592
$5,685
$5,778
Present Value of Free Cash Flow (2006-2009)
Present Value of Terminal Value
Enterprise Value
Implied Enterprise Value/2004E EBITDA Multiple
Present Value of Free Cash Flow (2006-2009)
Present Value of Terminal Value
Enterprise Value
Implied Enterprise Value/2004E EBITDA Multiple
Present Value of Free Cash Flow (2005-2009)
Present Value of Terminal Value
Enterprise Value
Impled Enterprise Value/2004E EBITDA Multiple
Growth and Margin Sensitivity
Revenue Growth Improvement
0.5%
$5,494
$5,588
$5,683
$5,778
$5,872
1.0%
$5,583
$5,679
$5,775
$5,872
$5,968
1.5%
$5,673
$5,771
$5,869
$5,967
$6,065
Note: % increase in EBITCA margin applies to 2009, each year assumes a 1th of the % increase in margin until 2009
Note: Assumes midpoints of the discounted cash flow matrix for discount rate (13%) and terminal EBITDA multiple (90)
2.0%
$5,764
$5,864
$5,964
$6,063
$6,163
24View entire presentation