Apollo Medical Holdings Investor Presentation Deck
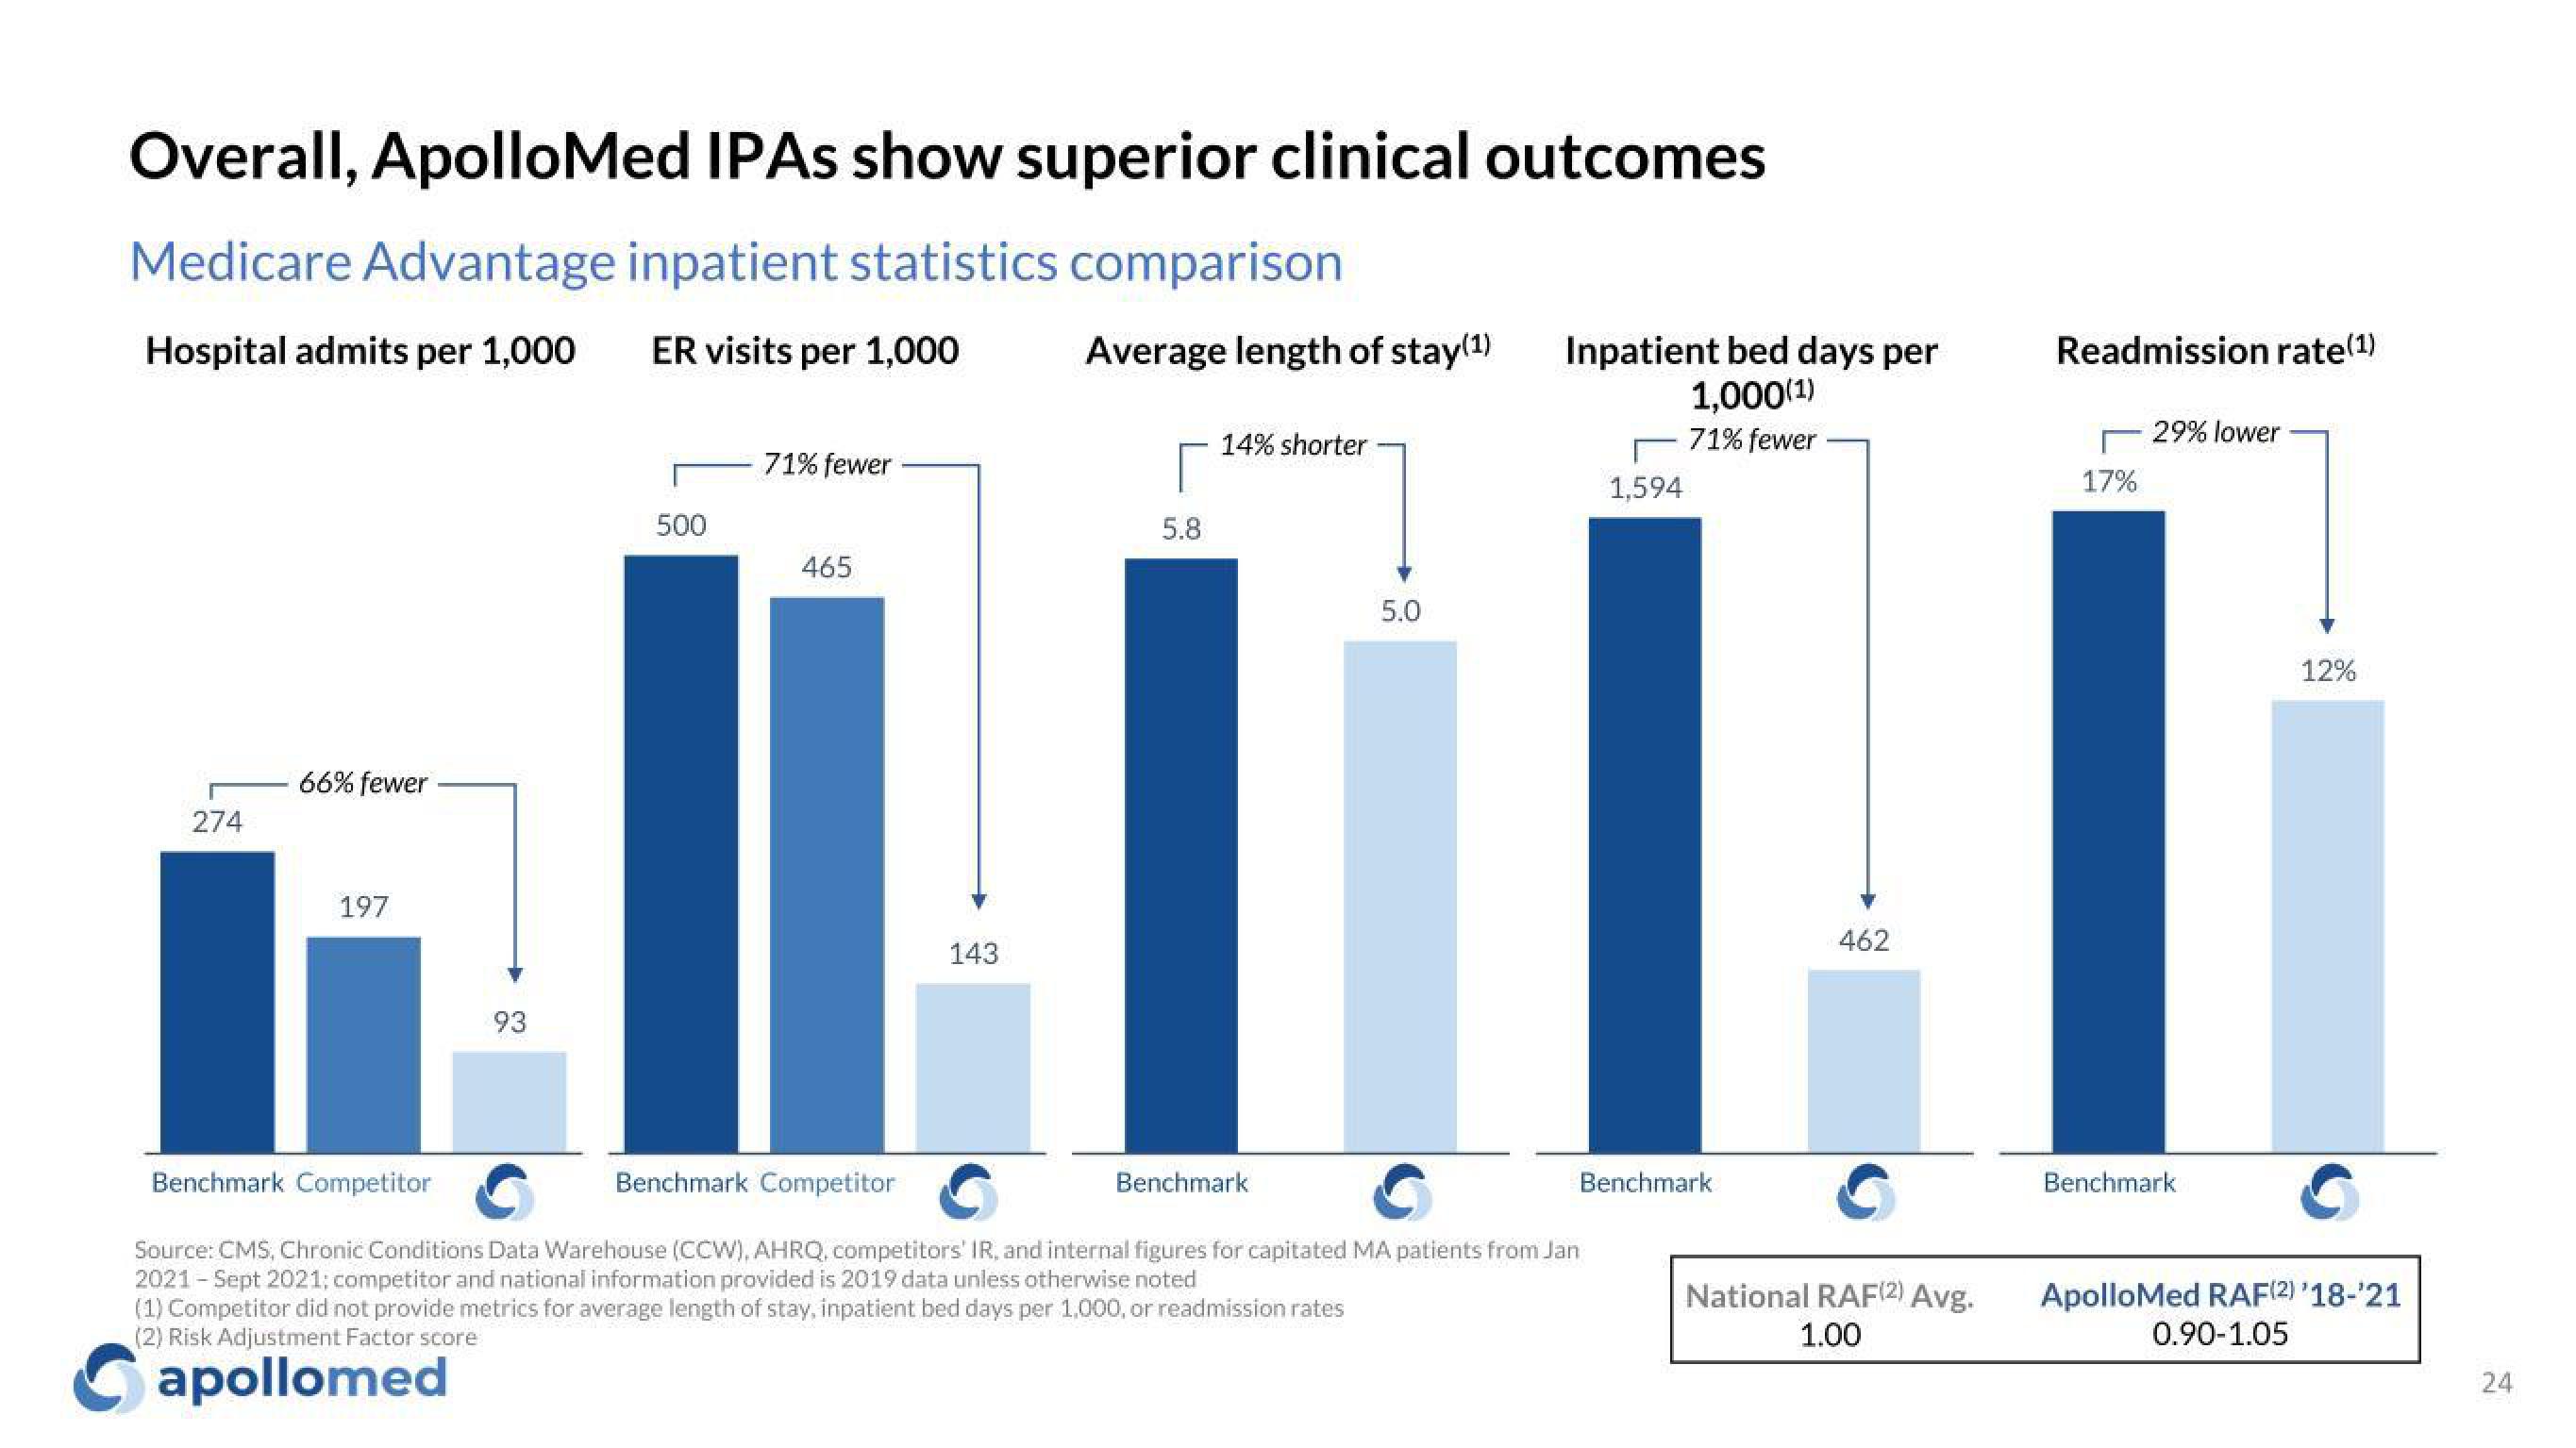
Overall, ApolloMed IPAs show superior clinical outcomes
Medicare Advantage inpatient statistics comparison
Hospital admits per 1,000
ER visits per 1,000
274
66% fewer
197
93
500
71% fewer
465
143
Average length of stay(1)
5.8
14% shorter
5.0
Benchmark
Inpatient bed days per
1,000(1)
71% fewer
Benchmark Competitor
Benchmark Competitor
Source: CMS, Chronic Conditions Data Warehouse (CCW), AHRQ, competitors' IR, and internal figures for capitated MA patients from Jan
2021-Sept 2021; competitor and national information provided is 2019 data unless otherwise noted
(1) Competitor did not provide metrics for average length of stay, inpatient bed days per 1,000, or readmission rates
(2) Risk Adjustment Factor score
apollomed
1,594
Benchmark
462
National RAF(2) Avg.
1.00
Readmission rate (1)
17%
29% lower
Benchmark
12%
ApolloMed RAF(2) '18-¹21
0.90-1.05
24View entire presentation