LVMH Results Presentation Deck
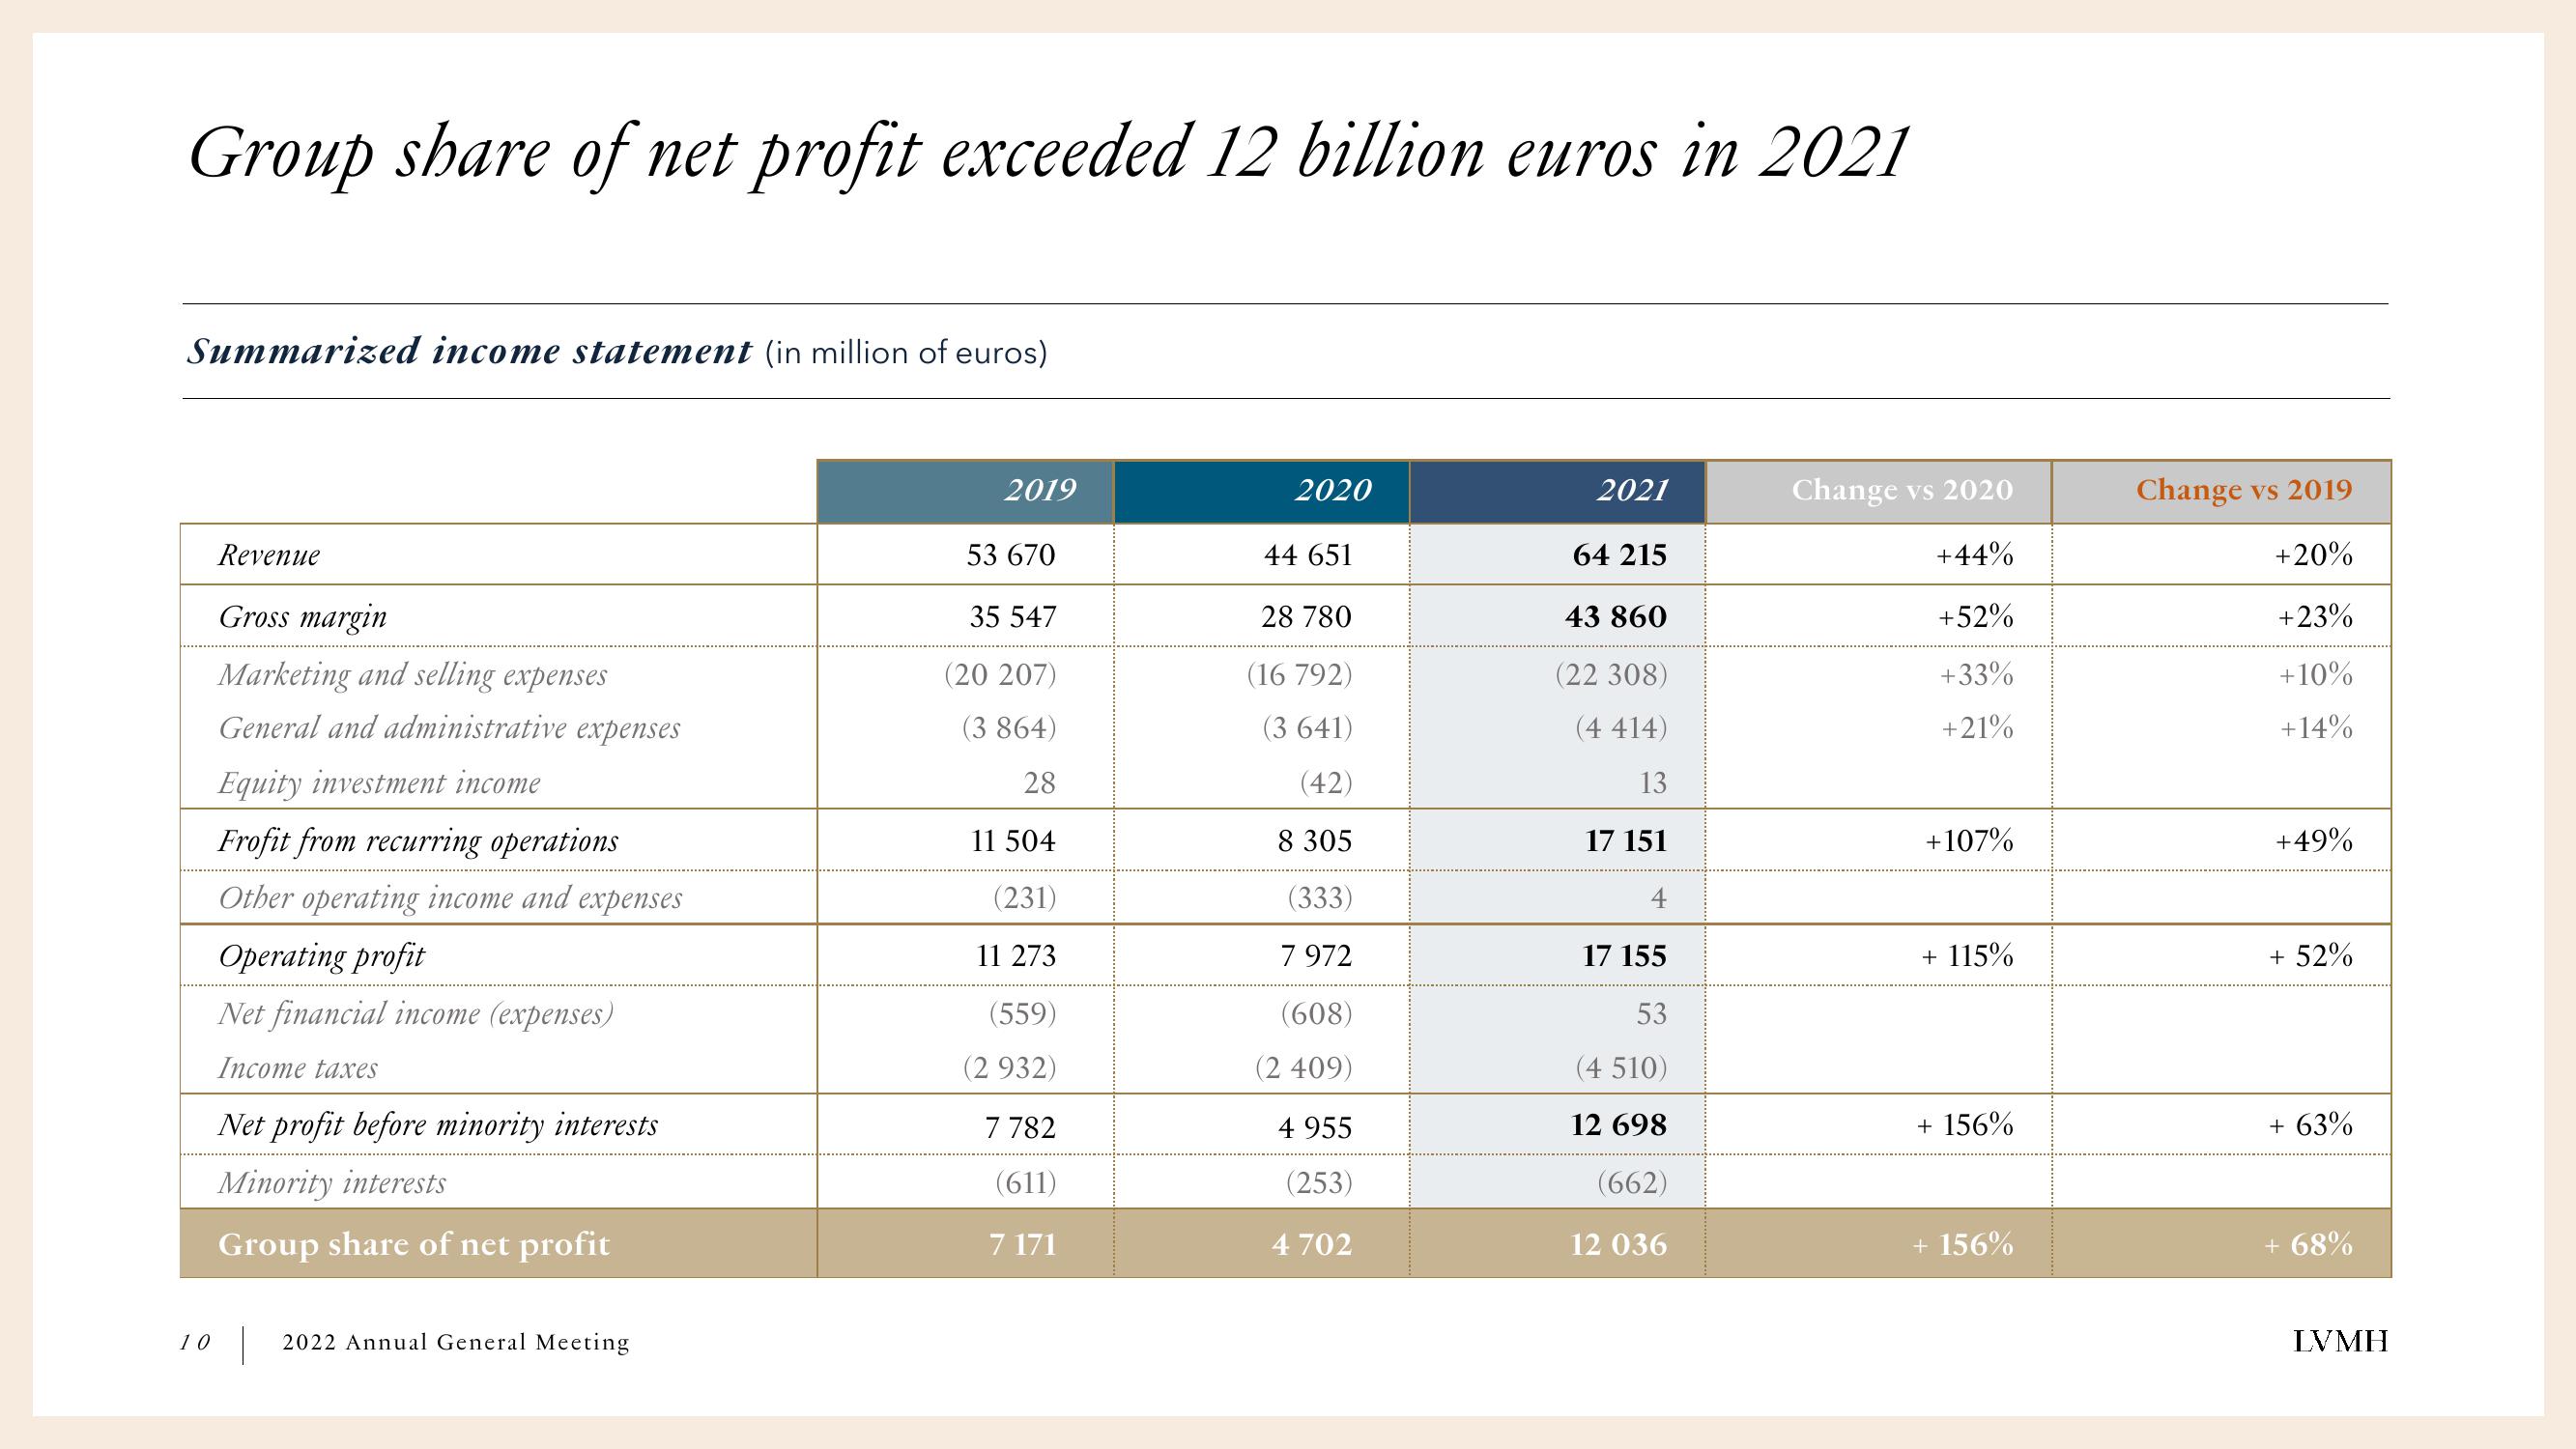
Group share of net profit exceeded 12 billion euros in 2021
Summarized income statement (in million of euros)
Revenue
Gross margin
Marketing and selling expenses
General and administrative expenses
Equity investment income
Frofit from recurring operations
Other operating income and expenses
Operating profit
Net financial income (expenses)
Income taxes
Net profit before minority interests
Minority interests
Group share of net profit
10 2022 Annual General Meeting
2019
53 670
35 547
(20 207)
(3 864)
28
11 504
(231)
11 273
(559)
(2 932)
7 782
(611)
7 171
2020
44 651
28 780
(16 792)
(3 641)
(42)
8 305
(333)
7 972
(608)
(2 409)
4 955
(253)
4 702
2021
64 215
43 860
(22 308)
(4 414)
13
17 151
17 155
53
(4 510)
12 698
(662)
12 036
Change vs 2020
+44%
+52%
+33%
+21%
+107%
+ 115%
+ 156%
+ 156%
Change vs 2019
+20%
+23%
+10%
+14%
+49%
+ 52%
+ 63%
+ 68%
LVMHView entire presentation