Overstock Results Presentation Deck slide image

Overstock Results Presentation Deck

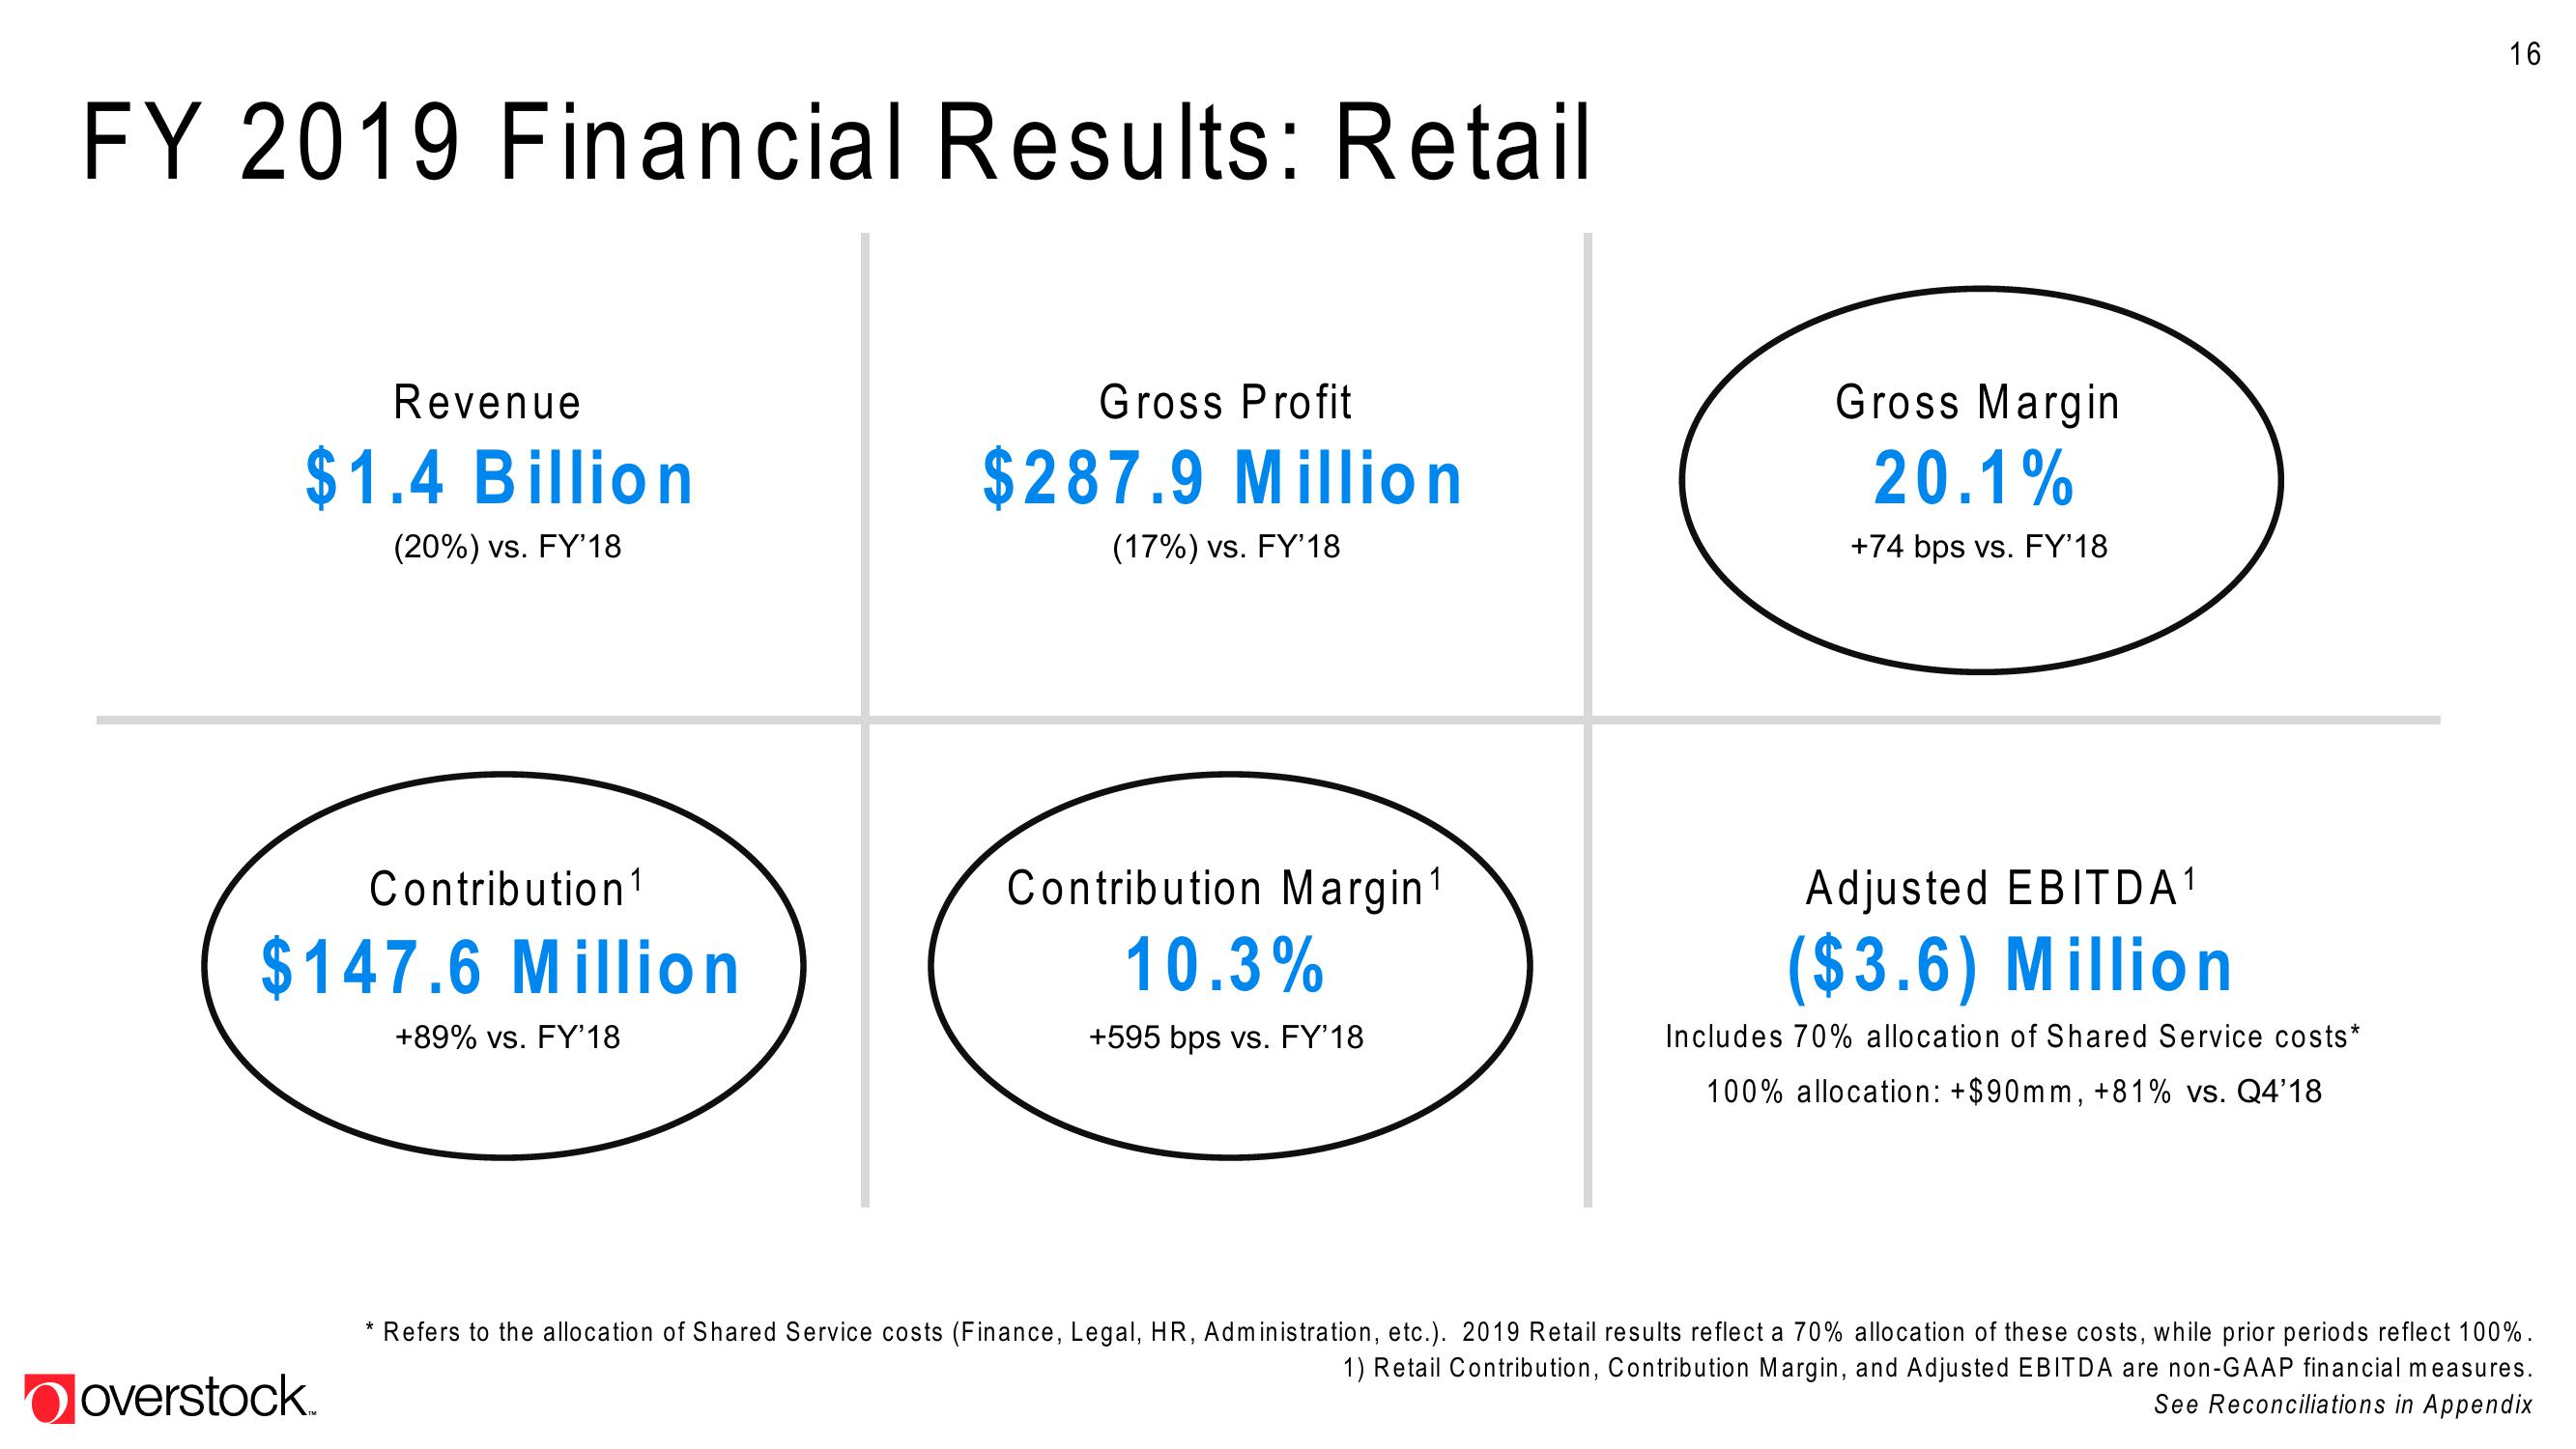
FY 2019 Financial Results: Retail Revenue $1.4 Billion (20%) vs. FY'18 overstock. Contribution¹ $147.6 Million +89% vs. FY'18 Gross Profit $287.9 Million (17%) vs. FY'18 Contribution Margin¹ 10.3% +595 bps vs. FY'18 Gross Margin 20.1% +74 bps vs. FY'18 Adjusted EBITDA1 ($3.6) Million Includes 70% allocation of Shared Service costs* 100% allocation: +$90mm, +81% vs. Q4'18 16 Refers to the allocation of Shared Service costs (Finance, Legal, HR, Administration, etc.). 2019 Retail results reflect a 70% allocation of these costs, while prior periods reflect 100%. 1) Retail Contribution, Contribution Margin, and Adjusted EBITDA are non-GAAP financial measures. See Reconciliations in Appendix
View entire presentation