Getty SPAC Presentation Deck
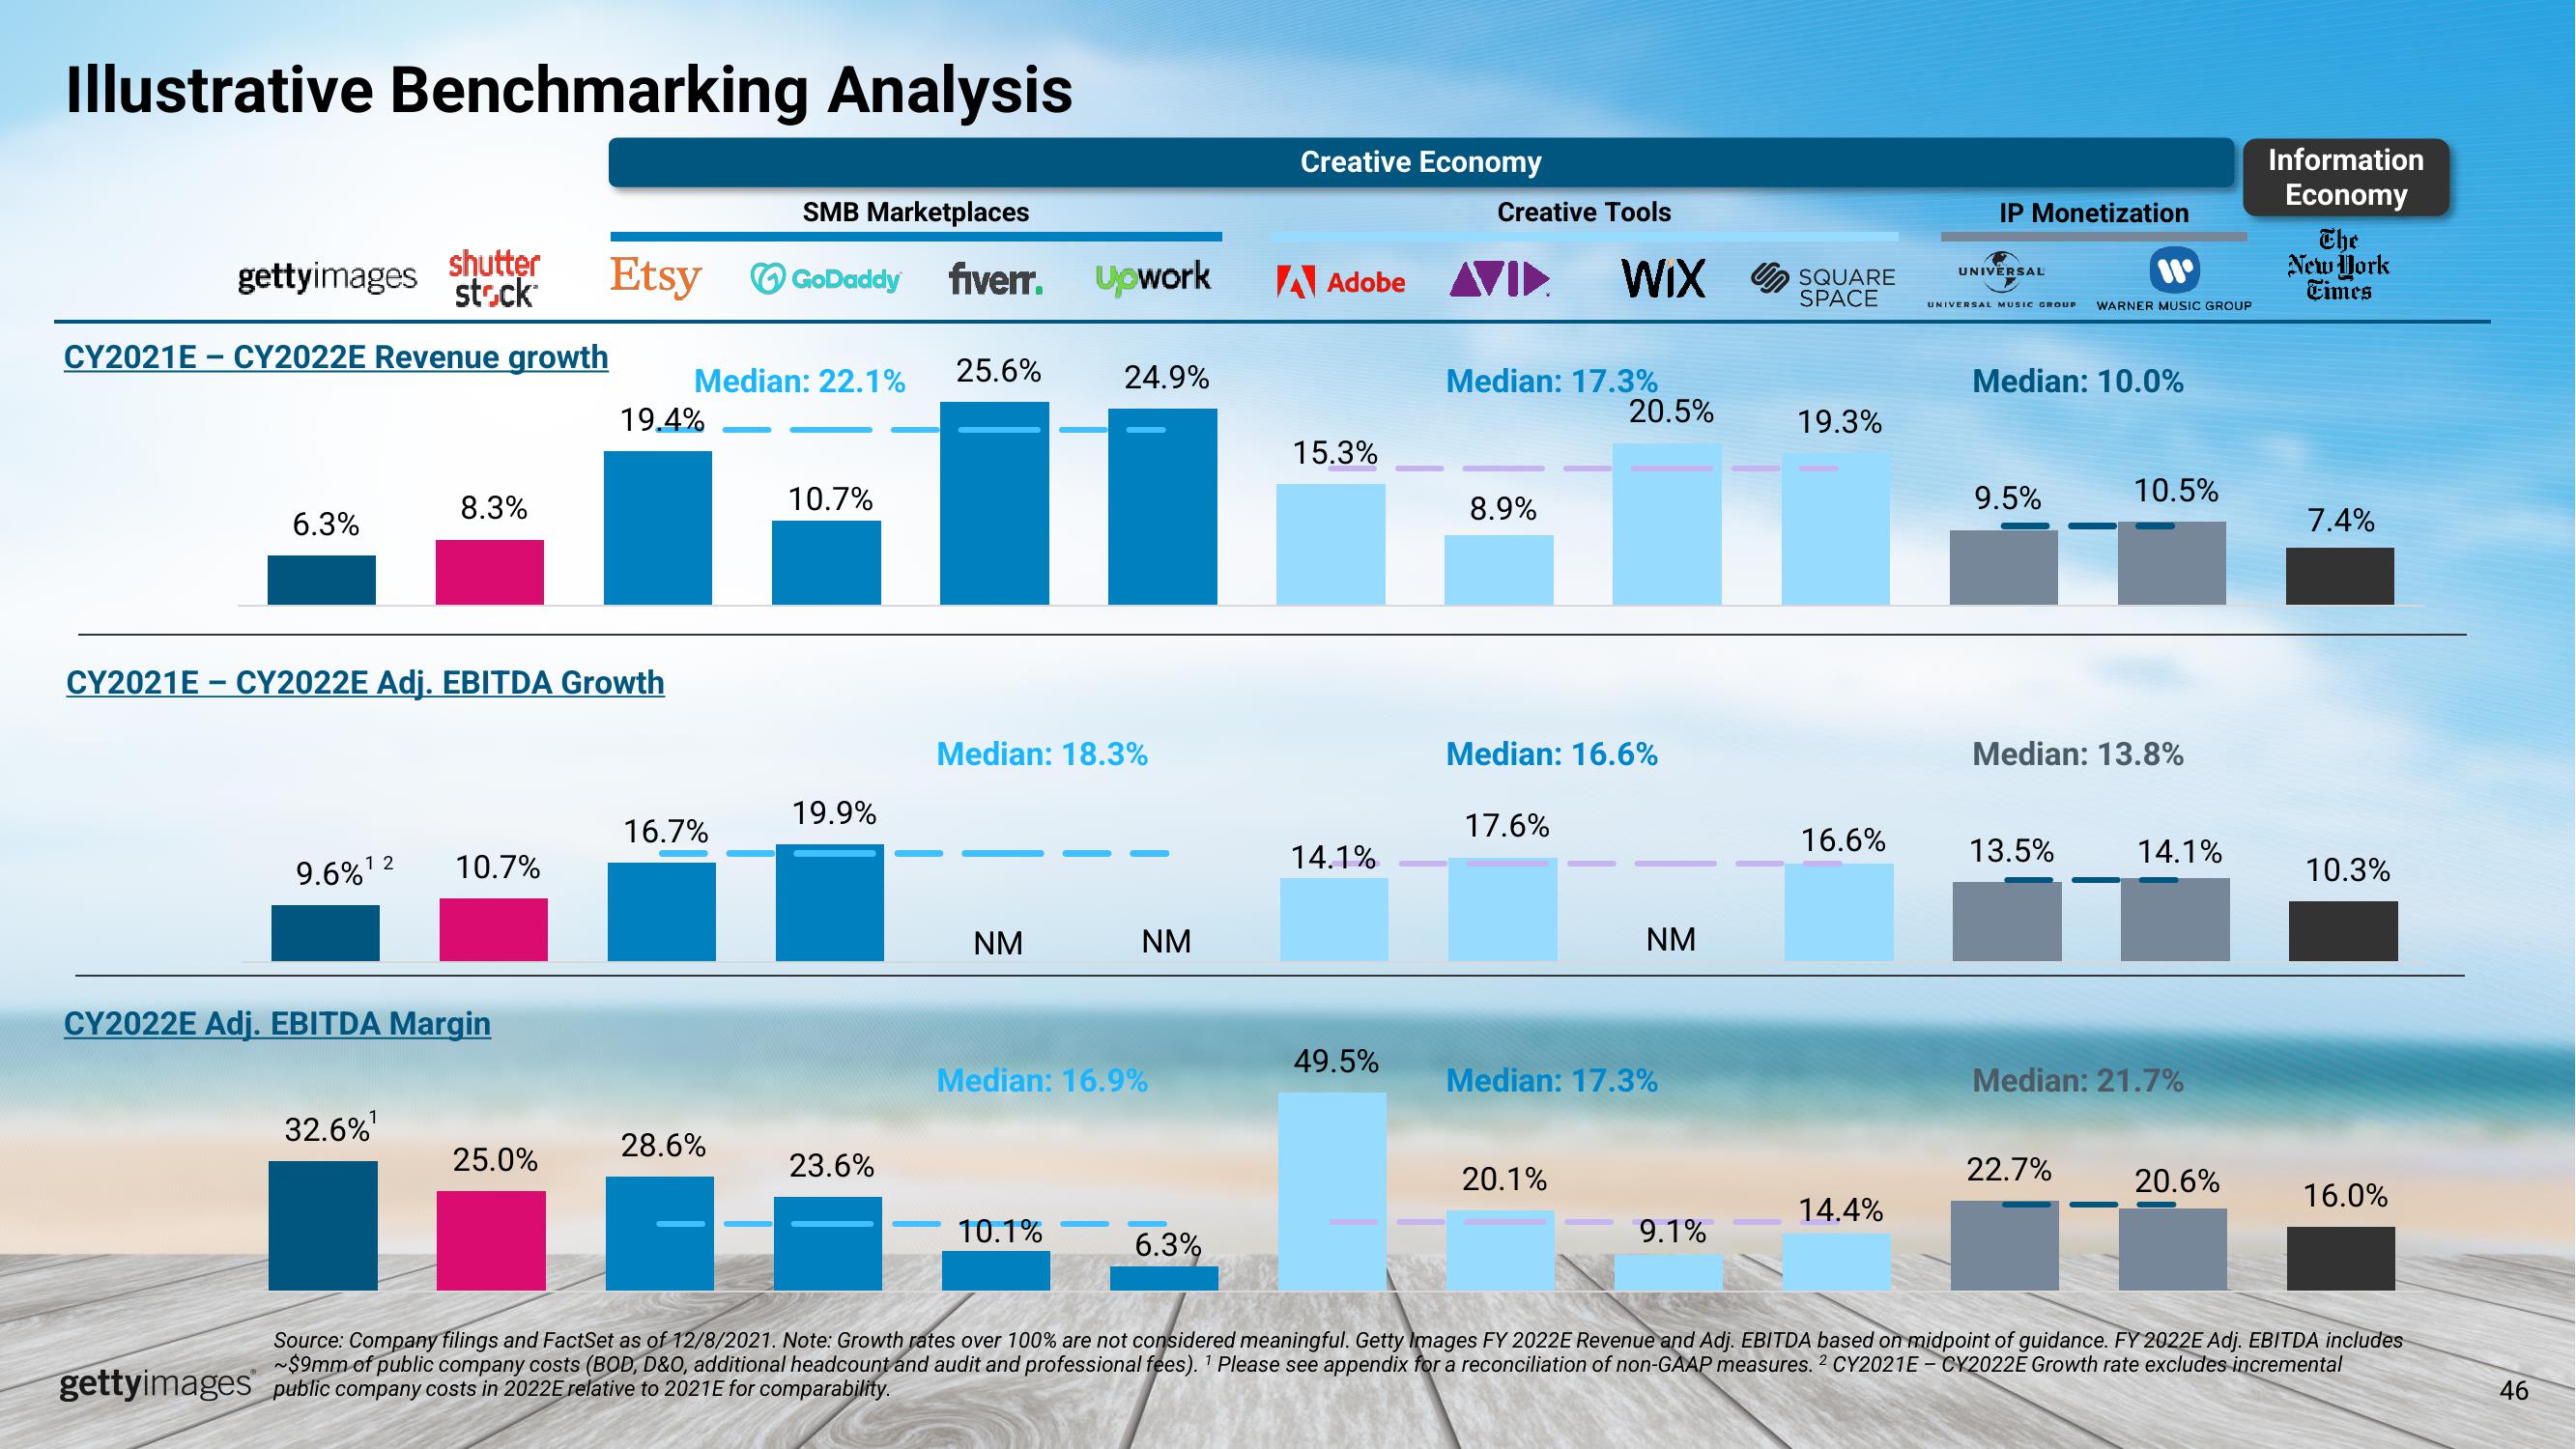
Illustrative Benchmarking Analysis
gettyimages
CY2021E-CY2022E Revenue growth
6.3%
shutter
Etsy
stock
8.3%
CY2021E-CY2022E Adj. EBITDA Growth
12
9.6% ¹2 10.7%
32.6%¹
CY2022E Adj. EBITDA Margin
25.0%
19.4%
Median: 22.1% 25.6%
16.7%
SMB Marketplaces
GoDaddy fiverr.
28.6%
10.7%
19.9%
23.6%
NM
Upwork
Median: 18.3%
24.9%
10.1%
NM
Median: 16.9%
6.3%
Creative Economy
A Adobe
15.3%
14.1%
49.5%
Creative Tools
Median: 17.3%
8.9%
WIX
17.6%
Median: 16.6%
20.5%
20.1%
NM
Median: 17.3%
9.1%
SQUARE
SPACE
19.3%
16.6%
14.4%
IP Monetization
UNIVERSAL
UNIVERSAL MUSIC GROUP WARNER MUSIC GROUP
Median: 10.0%
9.5%
Median: 13.8%
13.5%
10.5%
22.7%
14.1%
Median: 21.7%
20.6%
Information
Economy
The
New York
Times
7.4%
10.3%
16.0%
Source: Company filings and FactSet as of 12/8/2021. Note: Growth rates over 100% are not considered meaningful. Getty Images FY 2022E Revenue and Adj. EBITDA based on midpoint of guidance. FY 2022E Adj. EBITDA includes
~$9mm of public company costs (BOD, D&O, additional headcount and audit and professional fees). 1 Please see appendix for a reconciliation of non-GAAP measures. 2 CY2021E - CY2022E Growth rate excludes incremental
gettyimages public company costs in 2022E relative to 2021 E for comparability.
46View entire presentation