Truist Financial Corp Results Presentation Deck
Non-GAAP reconciliations
Diluted EPS
($ MM, except per share data, shares in thousands)
Net income available to common shareholders GAAP
Merger-related and restructuring charges
Securities (gains) losses
Loss (gain) on early extinguishment of debt
Incremental operating expenses related to the merger
Professional fee accrual
Gain on redemption of noncontrolling equity interest
Net income available to common shareholders - adjusted
Weighted average shares outstanding - diluted
Diluted EPS - GAAP
Diluted EPS - adjusted (¹)
$
LA
Sept. 30
2022
1,536 $
48
1
69
1,654 $
1,336,659
1.15 $
1.24
June 30
2022
1,454 $
92
(30)
89
T
Quarter Ended
March 31
2022
1,605 $
1,338,864
1.09 $
1.20
1,327 $
166
53
155
(57)
1,644 $
1,341,563
0.99 $
1.23
Dec. 31
2021
1,524 $
163
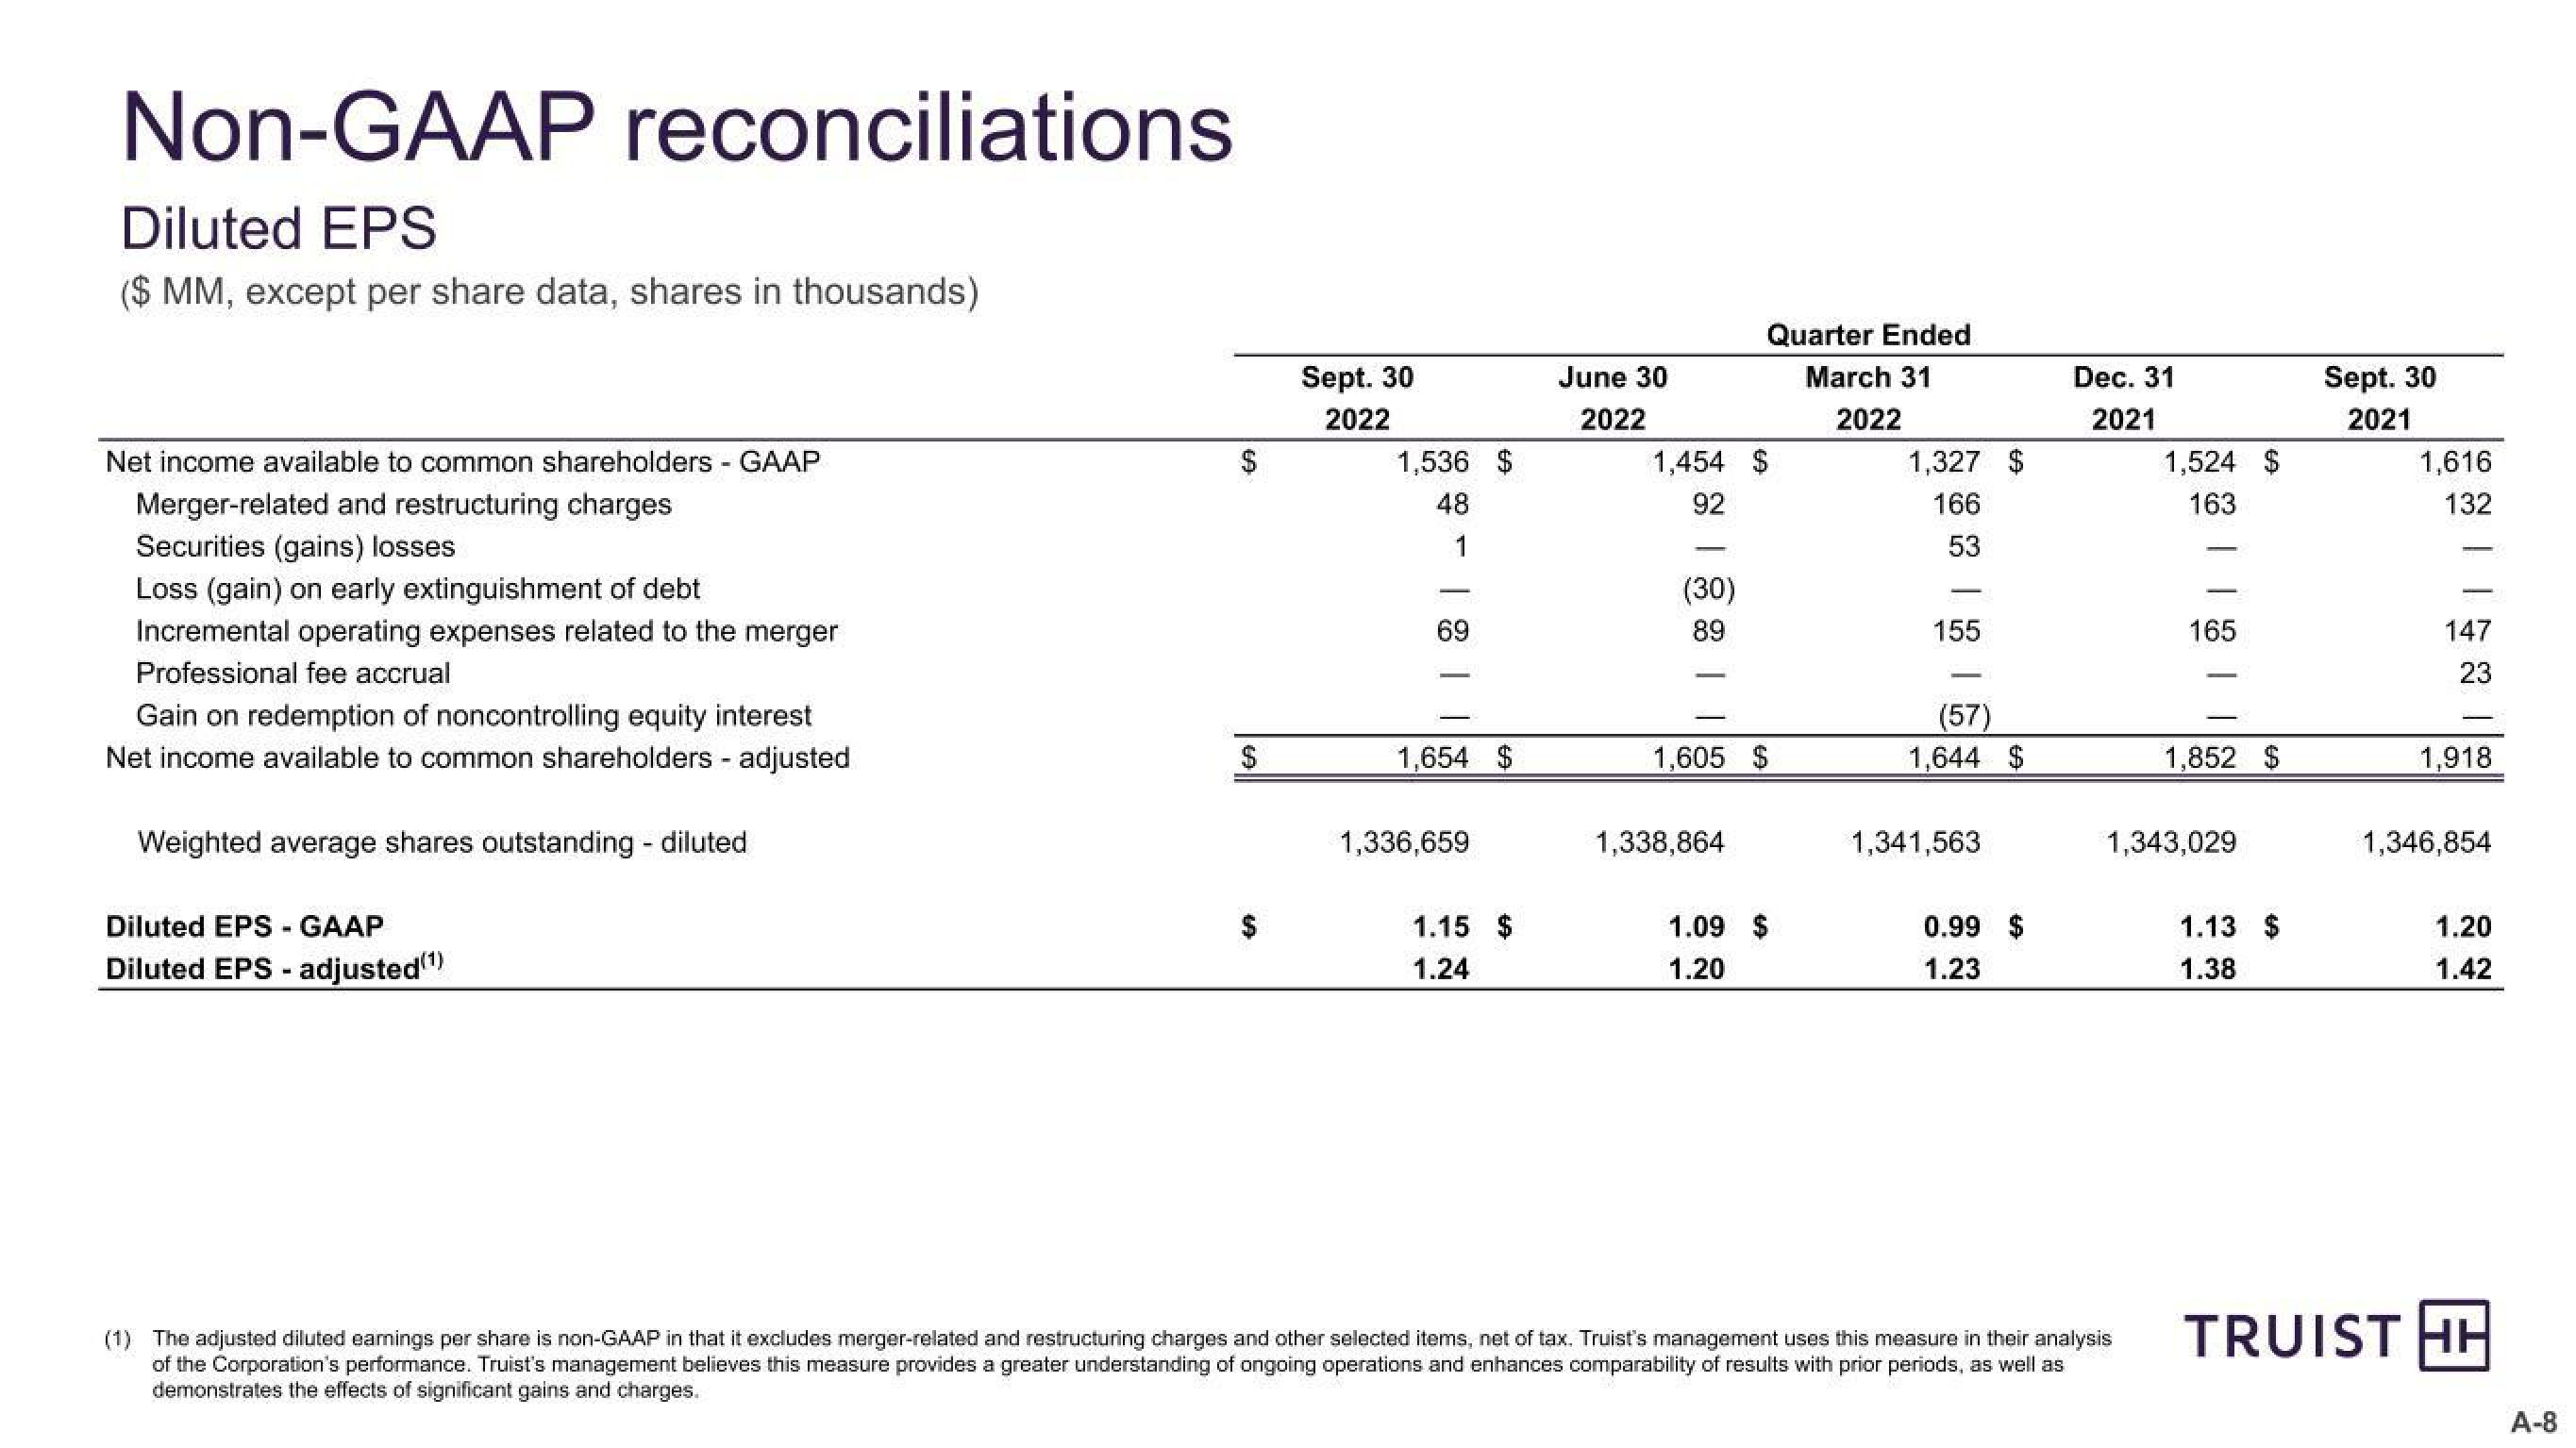
(1) The adjusted diluted earnings per share is non-GAAP in that it excludes merger-related and restructuring charges and other selected items, net of tax. Truist's management uses this measure in their analysis
of the Corporation's performance. Truist's management believes this measure provides a greater understanding of ongoing operations and enhances comparability of results with prior periods, as well as
demonstrates the effects of significant gains and charges.
165
1,852 $
1,343,029
1.13 $
1.38
Sept. 30
2021
1,616
132
147
23
1,918
1,346,854
1.20
1.42
TRUIST HH
A-8View entire presentation