TradeStation SPAC Presentation Deck
$6
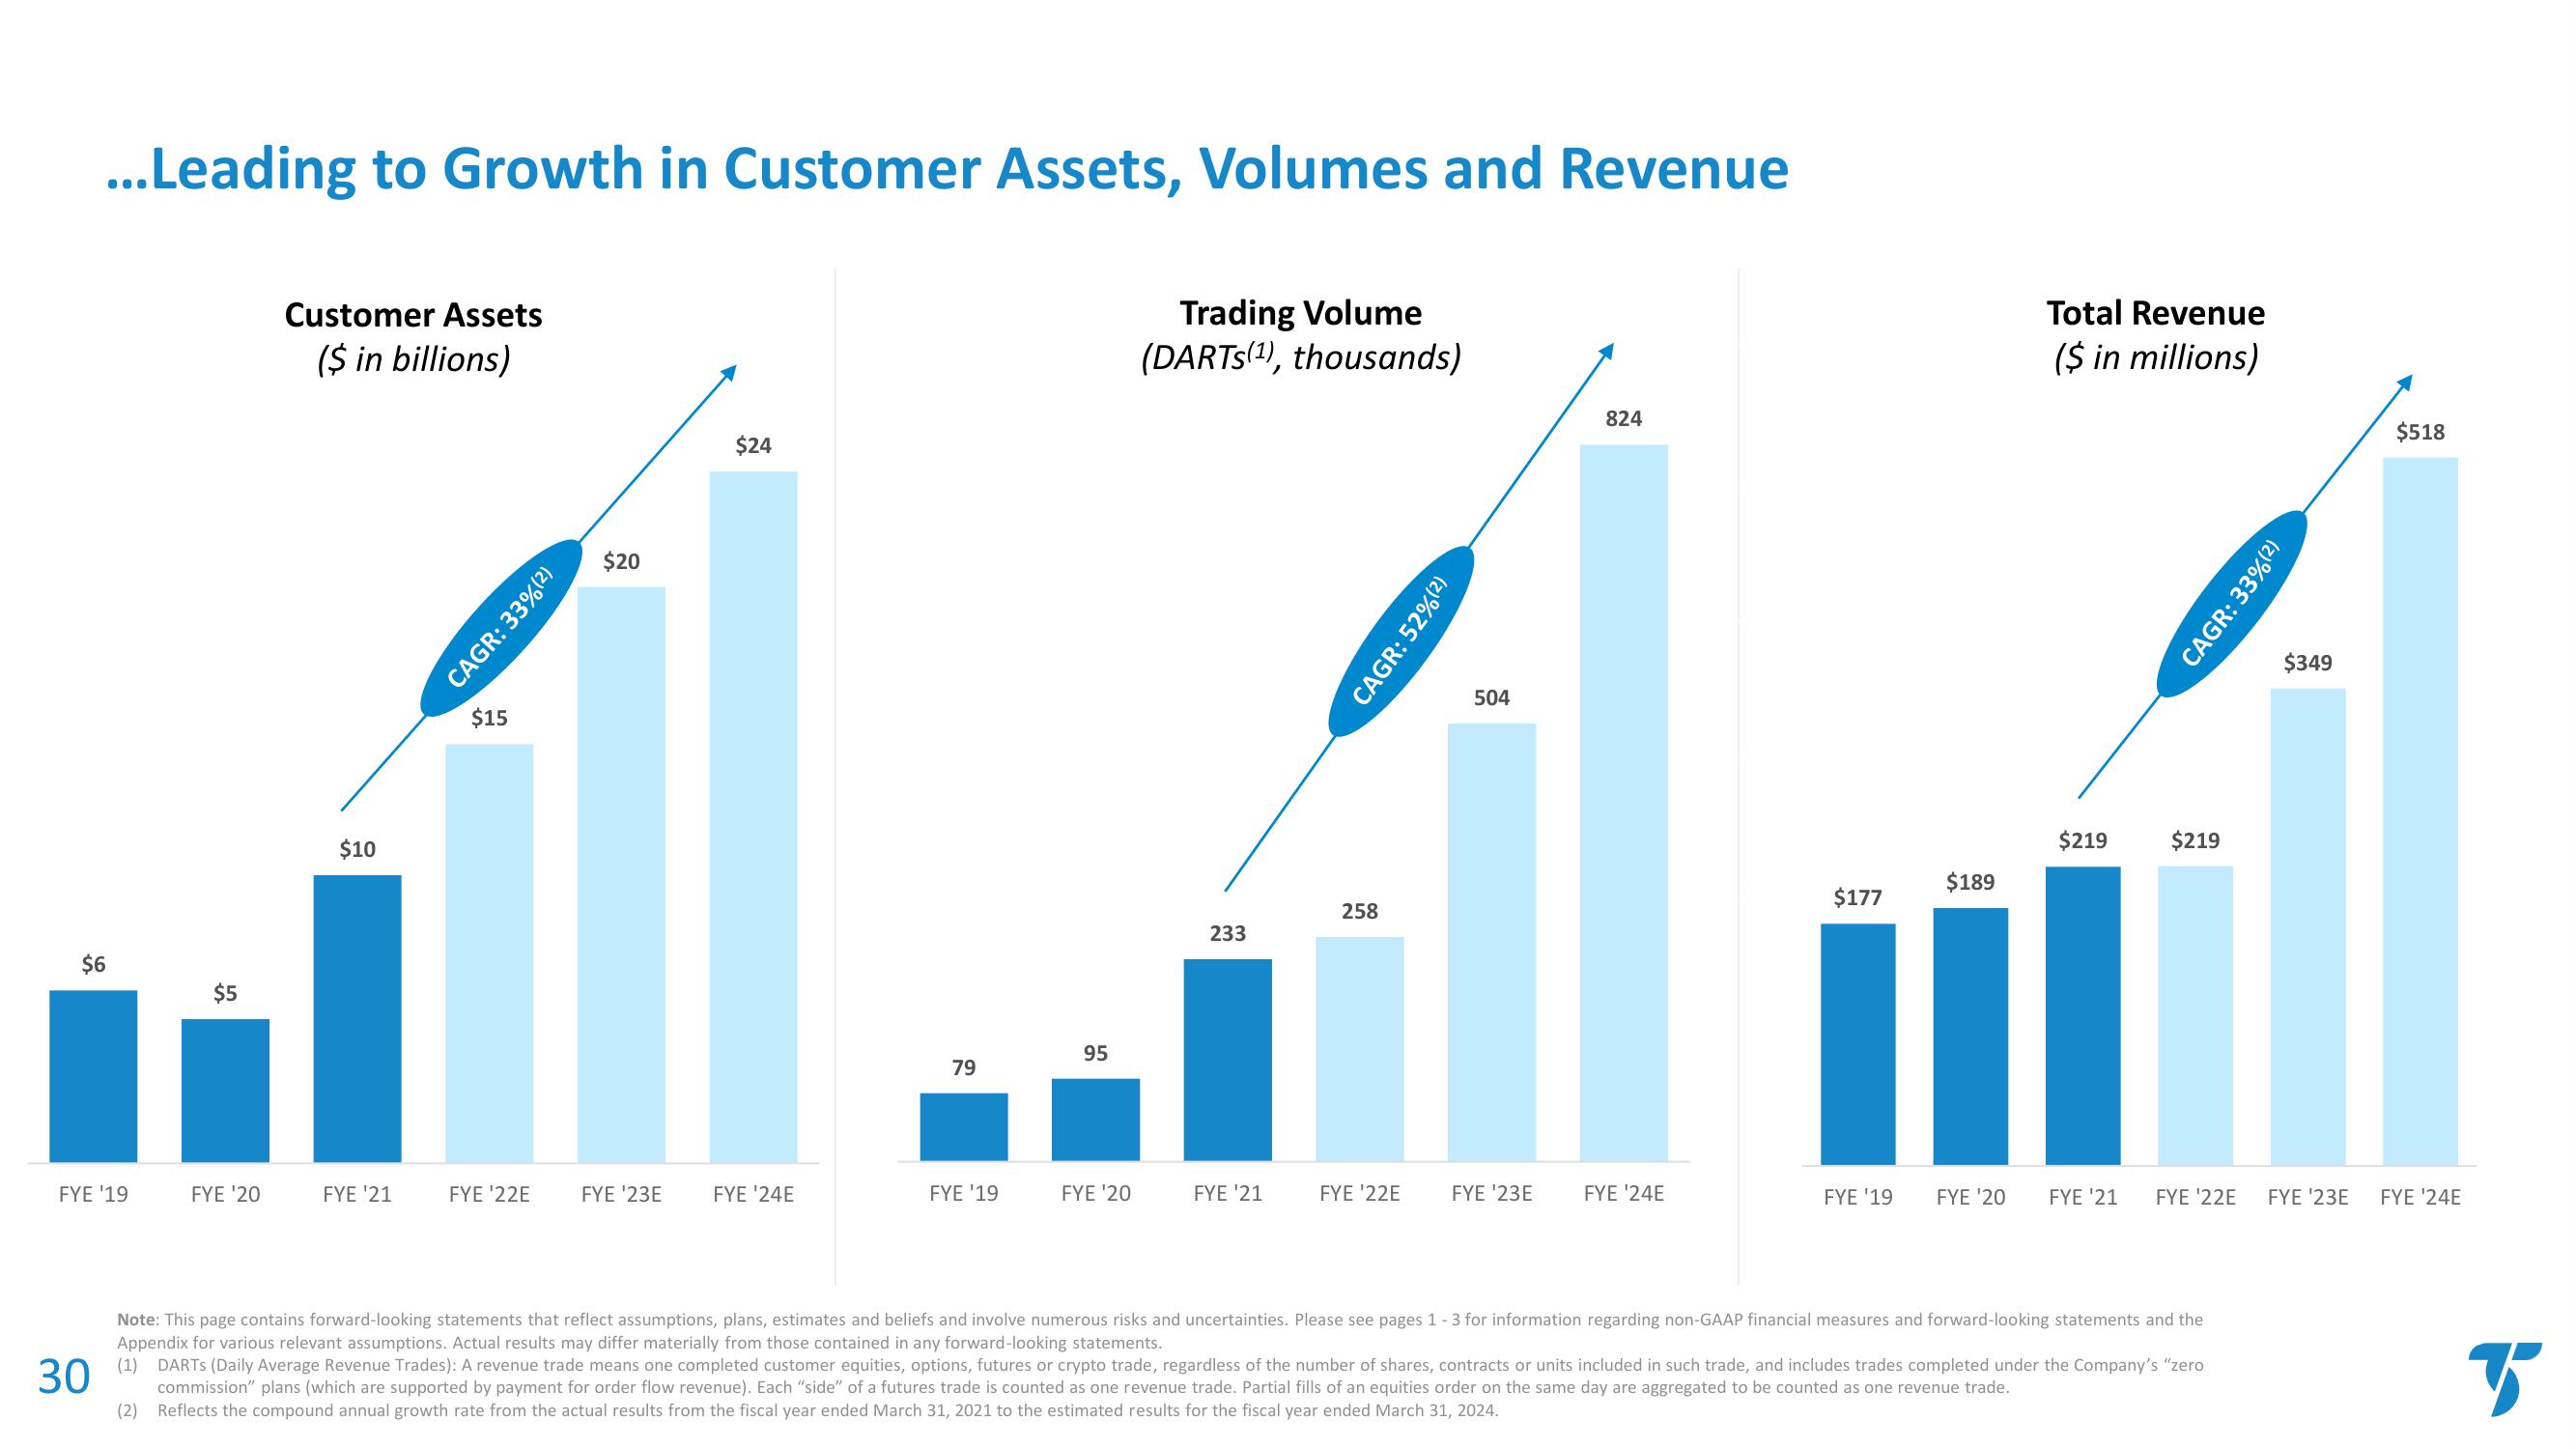
...Leading to Growth in Customer Assets, Volumes and Revenue
FYE '19
$5
FYE '20
Customer Assets
($ in billions)
$10
FYE '21
$15
FYE '22E
CAGR: 33% (2)
$20
FYE '23E
$24
FYE '24E
79
FYE '19
95
FYE '20
Trading Volume
(DARTS(¹), thousands)
233
FYE '21
258
FYE '22E
CAGR: 52%(2)
504
FYE ¹23E
824
FYE '24E
$177
FYE '19
$189
FYE '20
Total Revenue
($ in millions)
$219
$219
FYE '21 FYE '22E
Note: This page contains forward-looking statements that reflect assumptions, plans, estimates and beliefs and involve numerous risks and uncertainties. Please see pages 1 - 3 for information regarding non-GAAP financial measures and forward-looking statements and the
Appendix for various relevant assumptions. Actual results may differ materially from those contained in any forward-looking statements.
30
(1) DARTS (Daily Average Revenue Trades): A revenue trade means one completed customer equities, options, futures or crypto trade, regardless of the number of shares, contracts or units included in such trade, and includes trades completed under the Company's "zero
commission" plans (which are supported by payment for order flow revenue). Each "side" of a futures trade is counted as one revenue trade. Partial fills of an equities order on the same day are aggregated to be counted as one revenue trade.
(2) Reflects the compound annual growth rate from the actual results from the fiscal year ended March 31, 2021 to the estimated results for the fiscal year ended March 31, 2024.
CAGR: 33% (²)
$349
$518
FYE '23E FYE '24E
BView entire presentation