Innovid Investor Day Presentation Deck
| Well Positioned for Margin Expansion on Growth
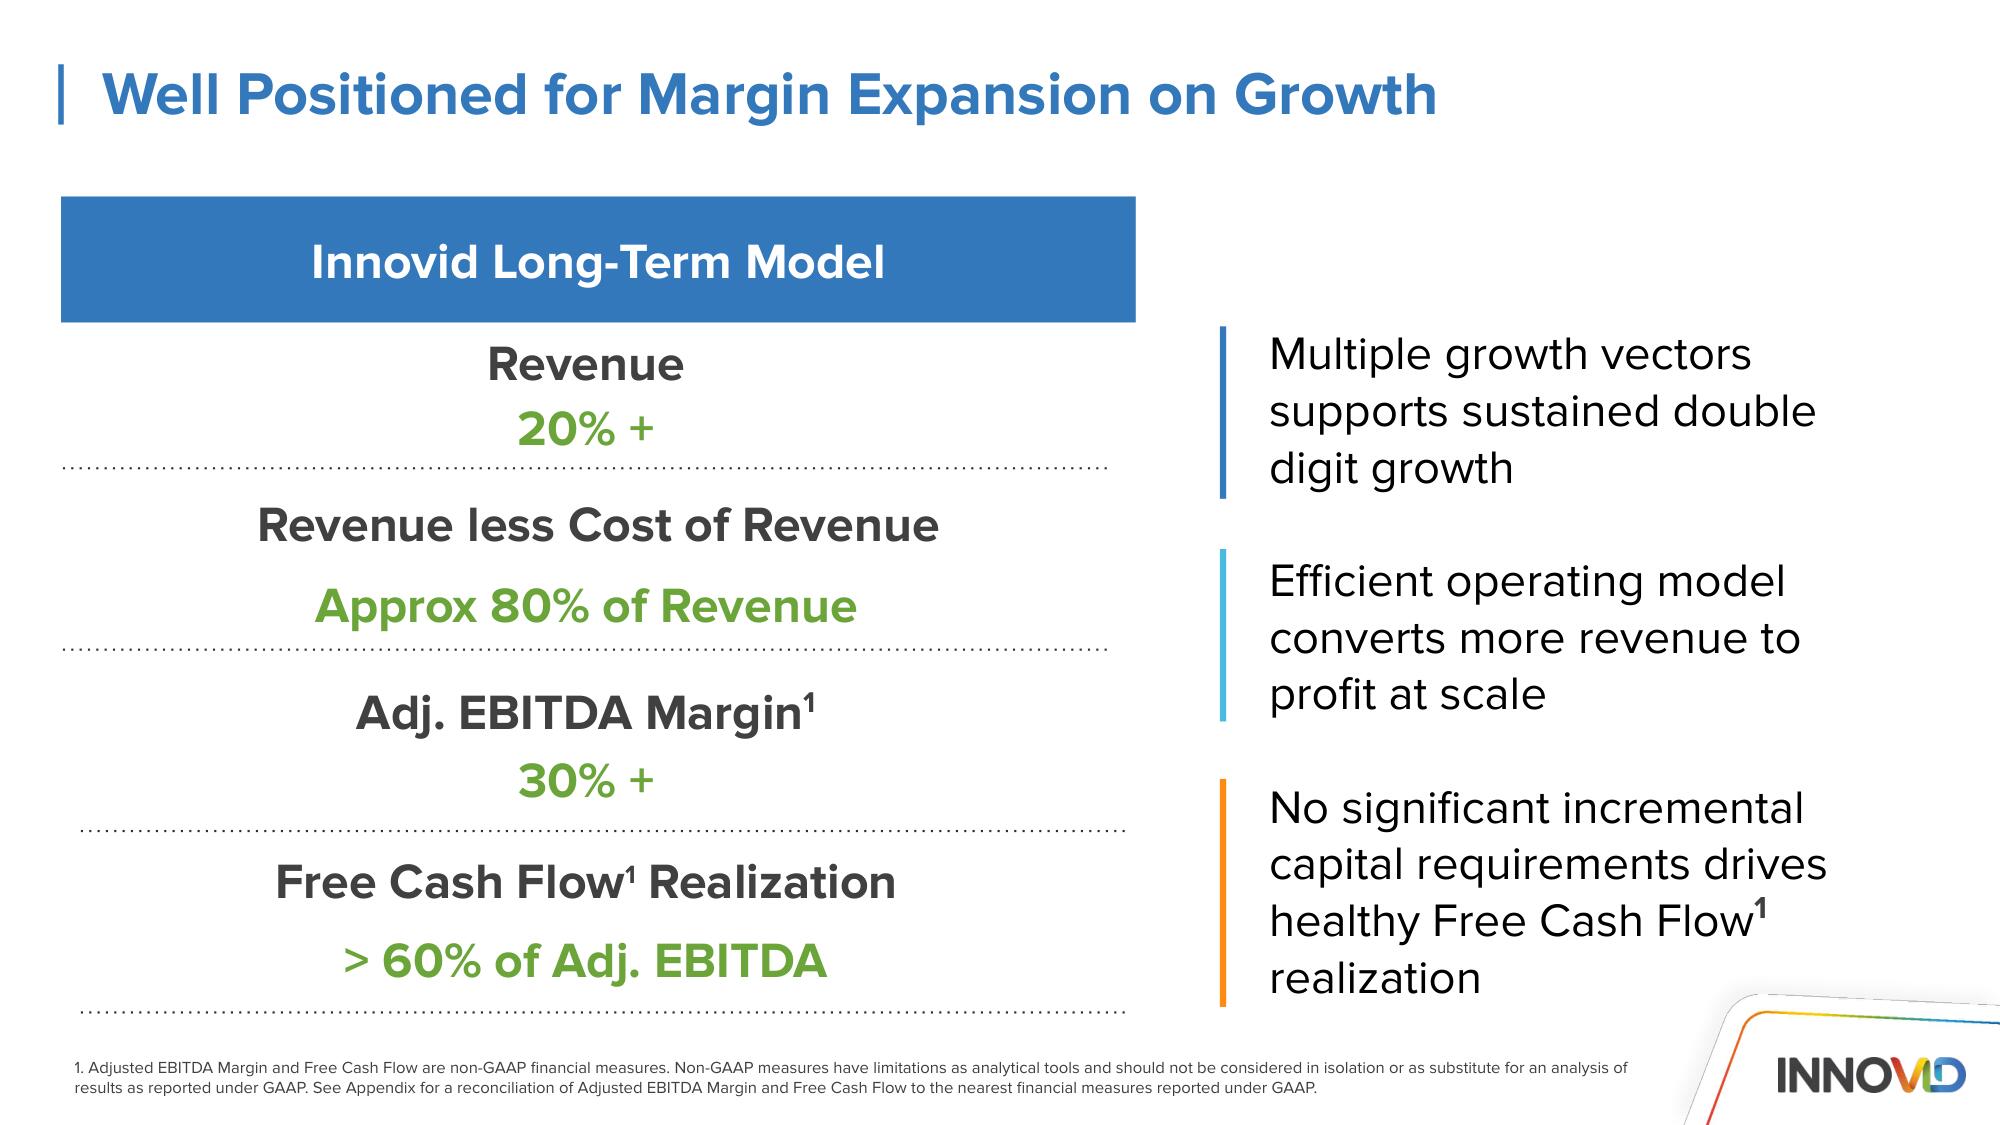
Innovid Long-Term Model
Revenue
20% +
Revenue less Cost of Revenue
Approx 80% of Revenue
Adj. EBITDA Margin¹
30% +
Free Cash Flow¹ Realization
> 60% of Adj. EBITDA
Multiple growth vectors
supports sustained double
digit growth
Efficient operating model
converts more revenue to
profit at scale
No significant incremental
capital requirements drives
healthy Free Cash Flow¹
realization
1. Adjusted EBITDA Margin and Free Cash Flow are non-GAAP financial measures. Non-GAAP measures have limitations as analytical tools and should not be considered in isolation or as substitute for an analysis of
results as reported under GAAP. See Appendix for a reconciliation of Adjusted EBITDA Margin and Free Cash Flow to the nearest financial measures reported under GAAP.
INNOVDView entire presentation