AvePoint SPAC Presentation Deck
25
($ in millions)
GAAP gross profit
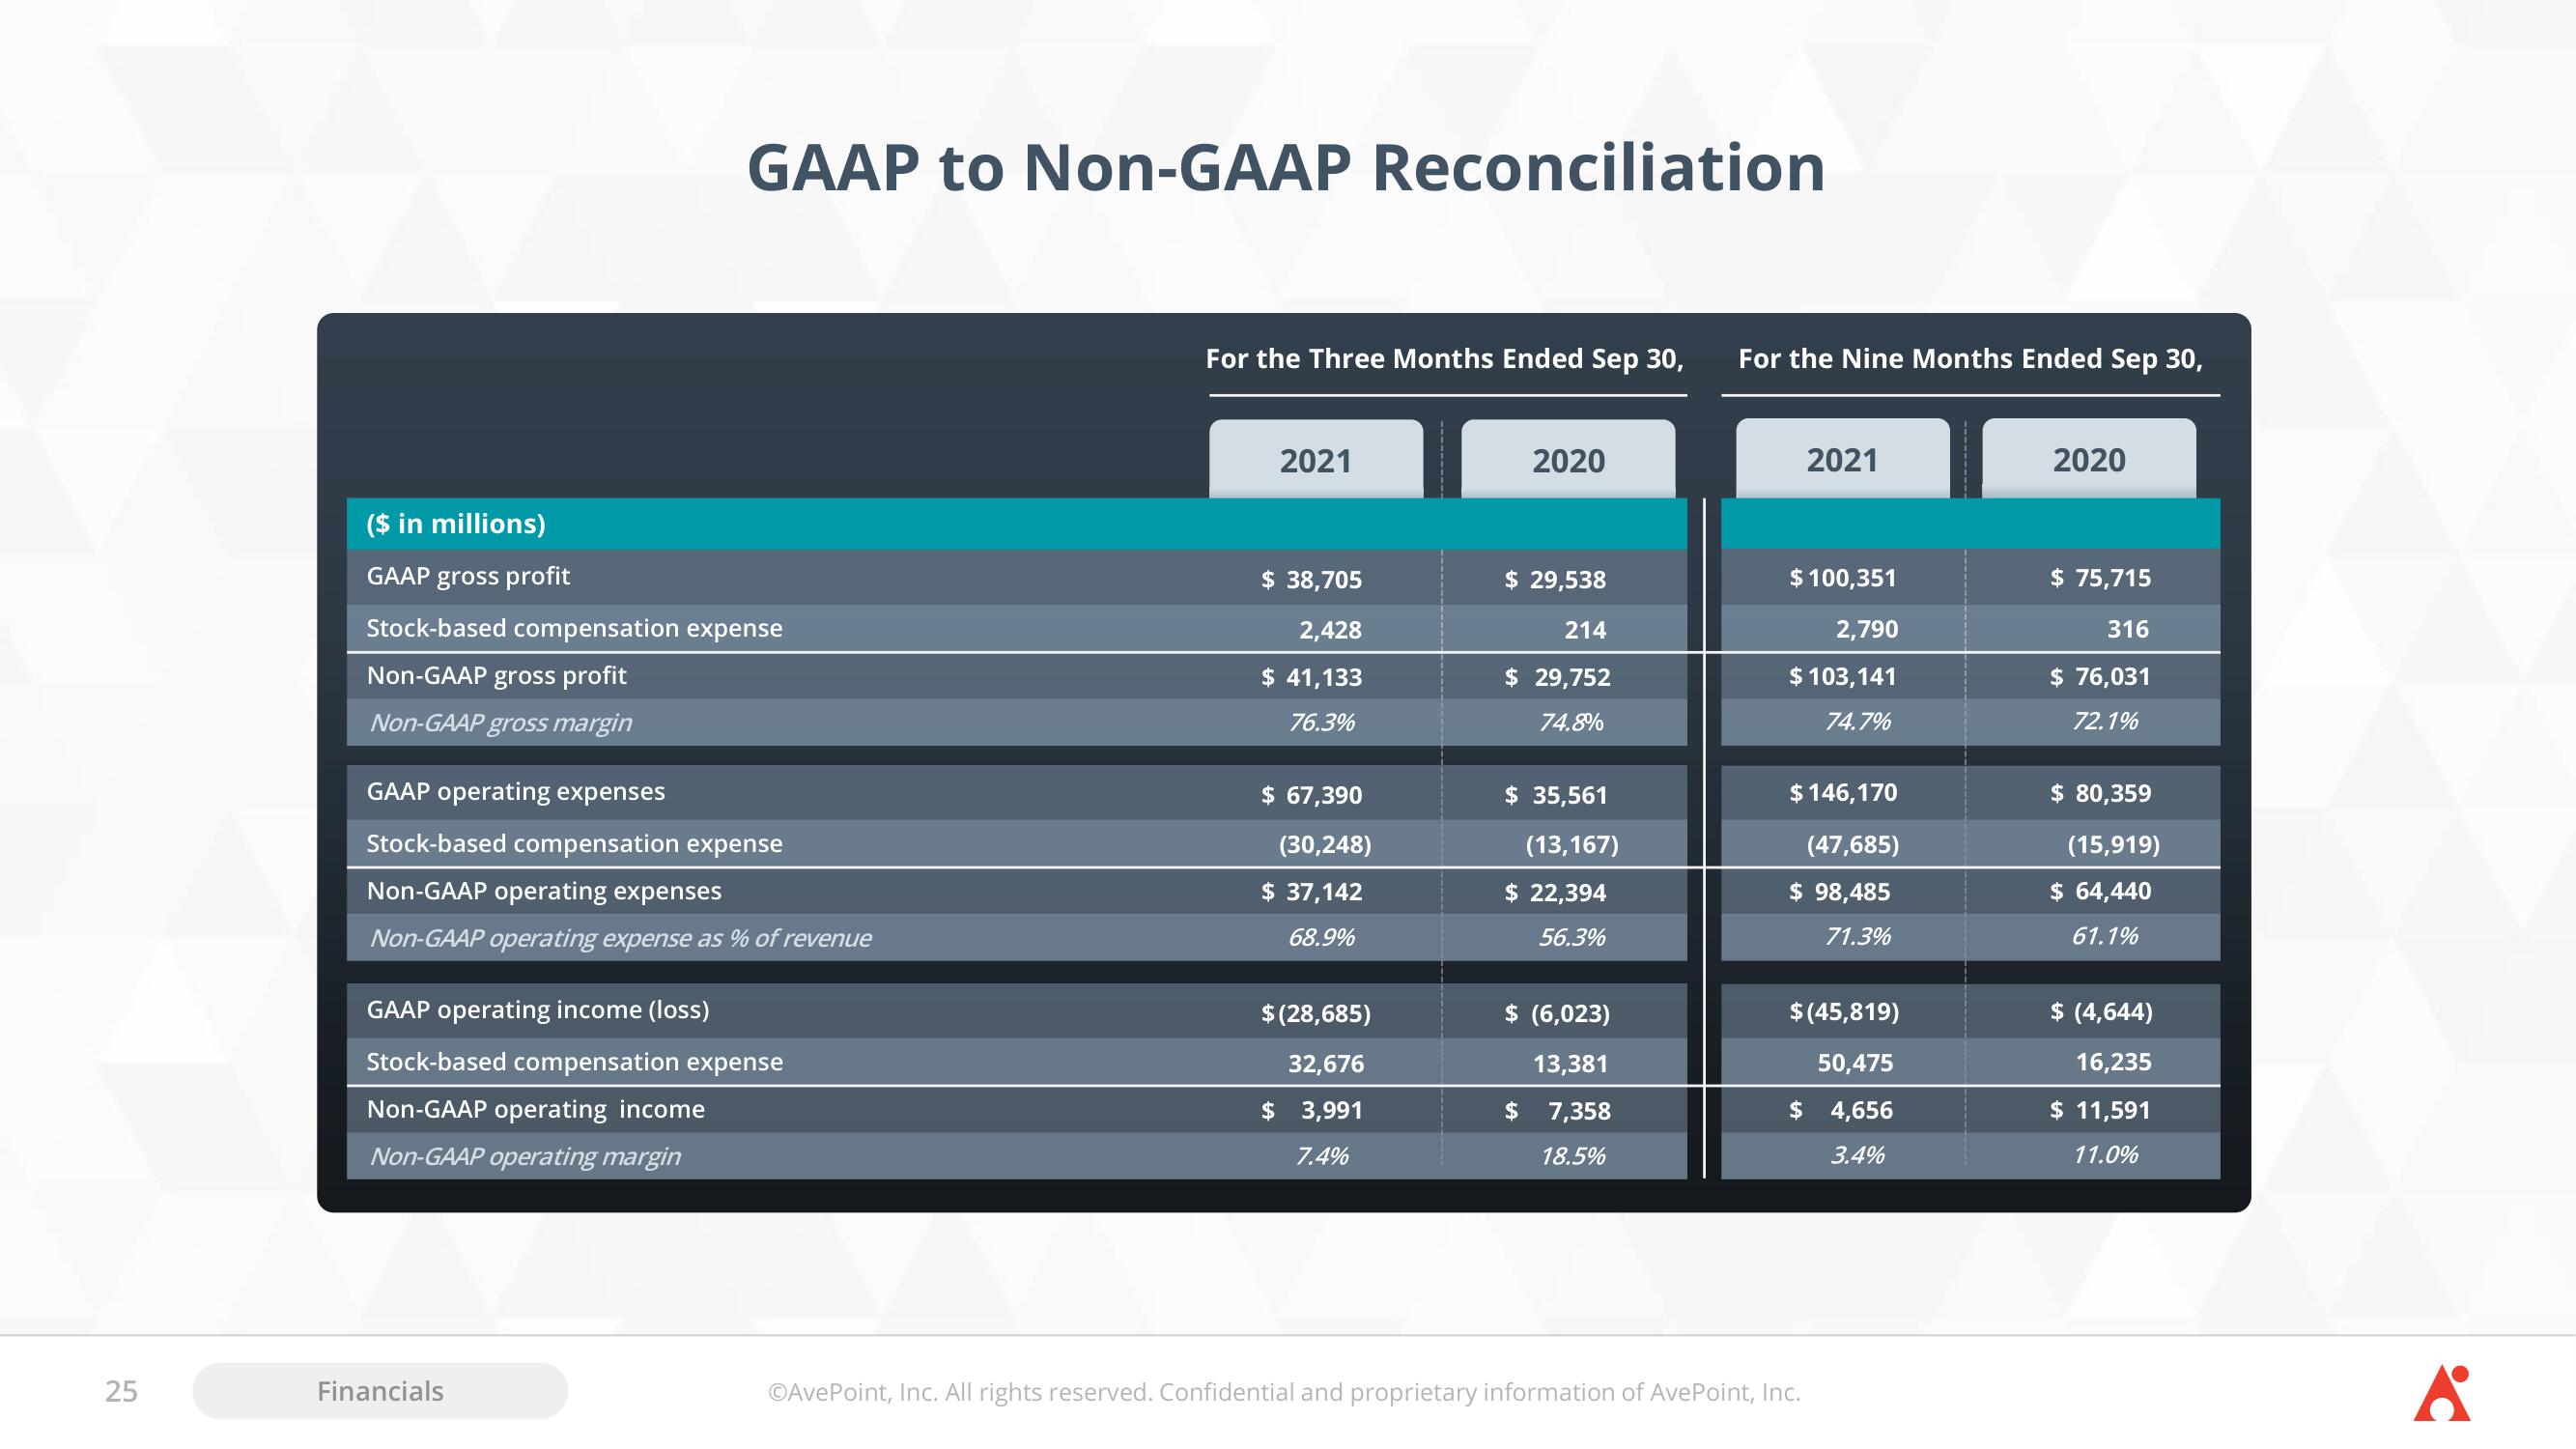
GAAP to Non-GAAP Reconciliation
Stock-based compensation expense
Non-GAAP gross profit
Non-GAAP gross margin
GAAP operating expenses
Stock-based compensation expense
Non-GAAP operating expenses
Non-GAAP operating expense as % of revenue
GAAP operating income (loss)
Stock-based compensation expense
Non-GAAP operating income
Non-GAAP operating margin
Financials
For the Three Months Ended Sep 30,
2021
$ 38,705
2,428
$ 41,133
76.3%
$ 67,390
(30,248)
$ 37,142
68.9%
$ (28,685)
32,676
$ 3,991
7.4%
2020
$ 29,538
214
$ 29,752
74.8%
$ 35,561
(13,167)
$ 22,394
56.3%
$ (6,023)
13,381
7,358
18.5%
For the Nine Months Ended Sep 30,
2021
$ 100,351
2,790
$ 103,141
74.7%
$ 146,170
(47,685)
$ 98,485
71.3%
$ (45,819)
50,475
$ 4,656
3.4%
ⒸAvePoint, Inc. All rights reserved. Confidential and proprietary information of AvePoint, Inc.
2020
$ 75,715
316
$ 76,031
72.1%
$ 80,359
(15,919)
$ 64,440
61.1%
$ (4,644)
16,235
$ 11,591
11.0%
6View entire presentation