Confluent Investor Presentation Deck
(1)
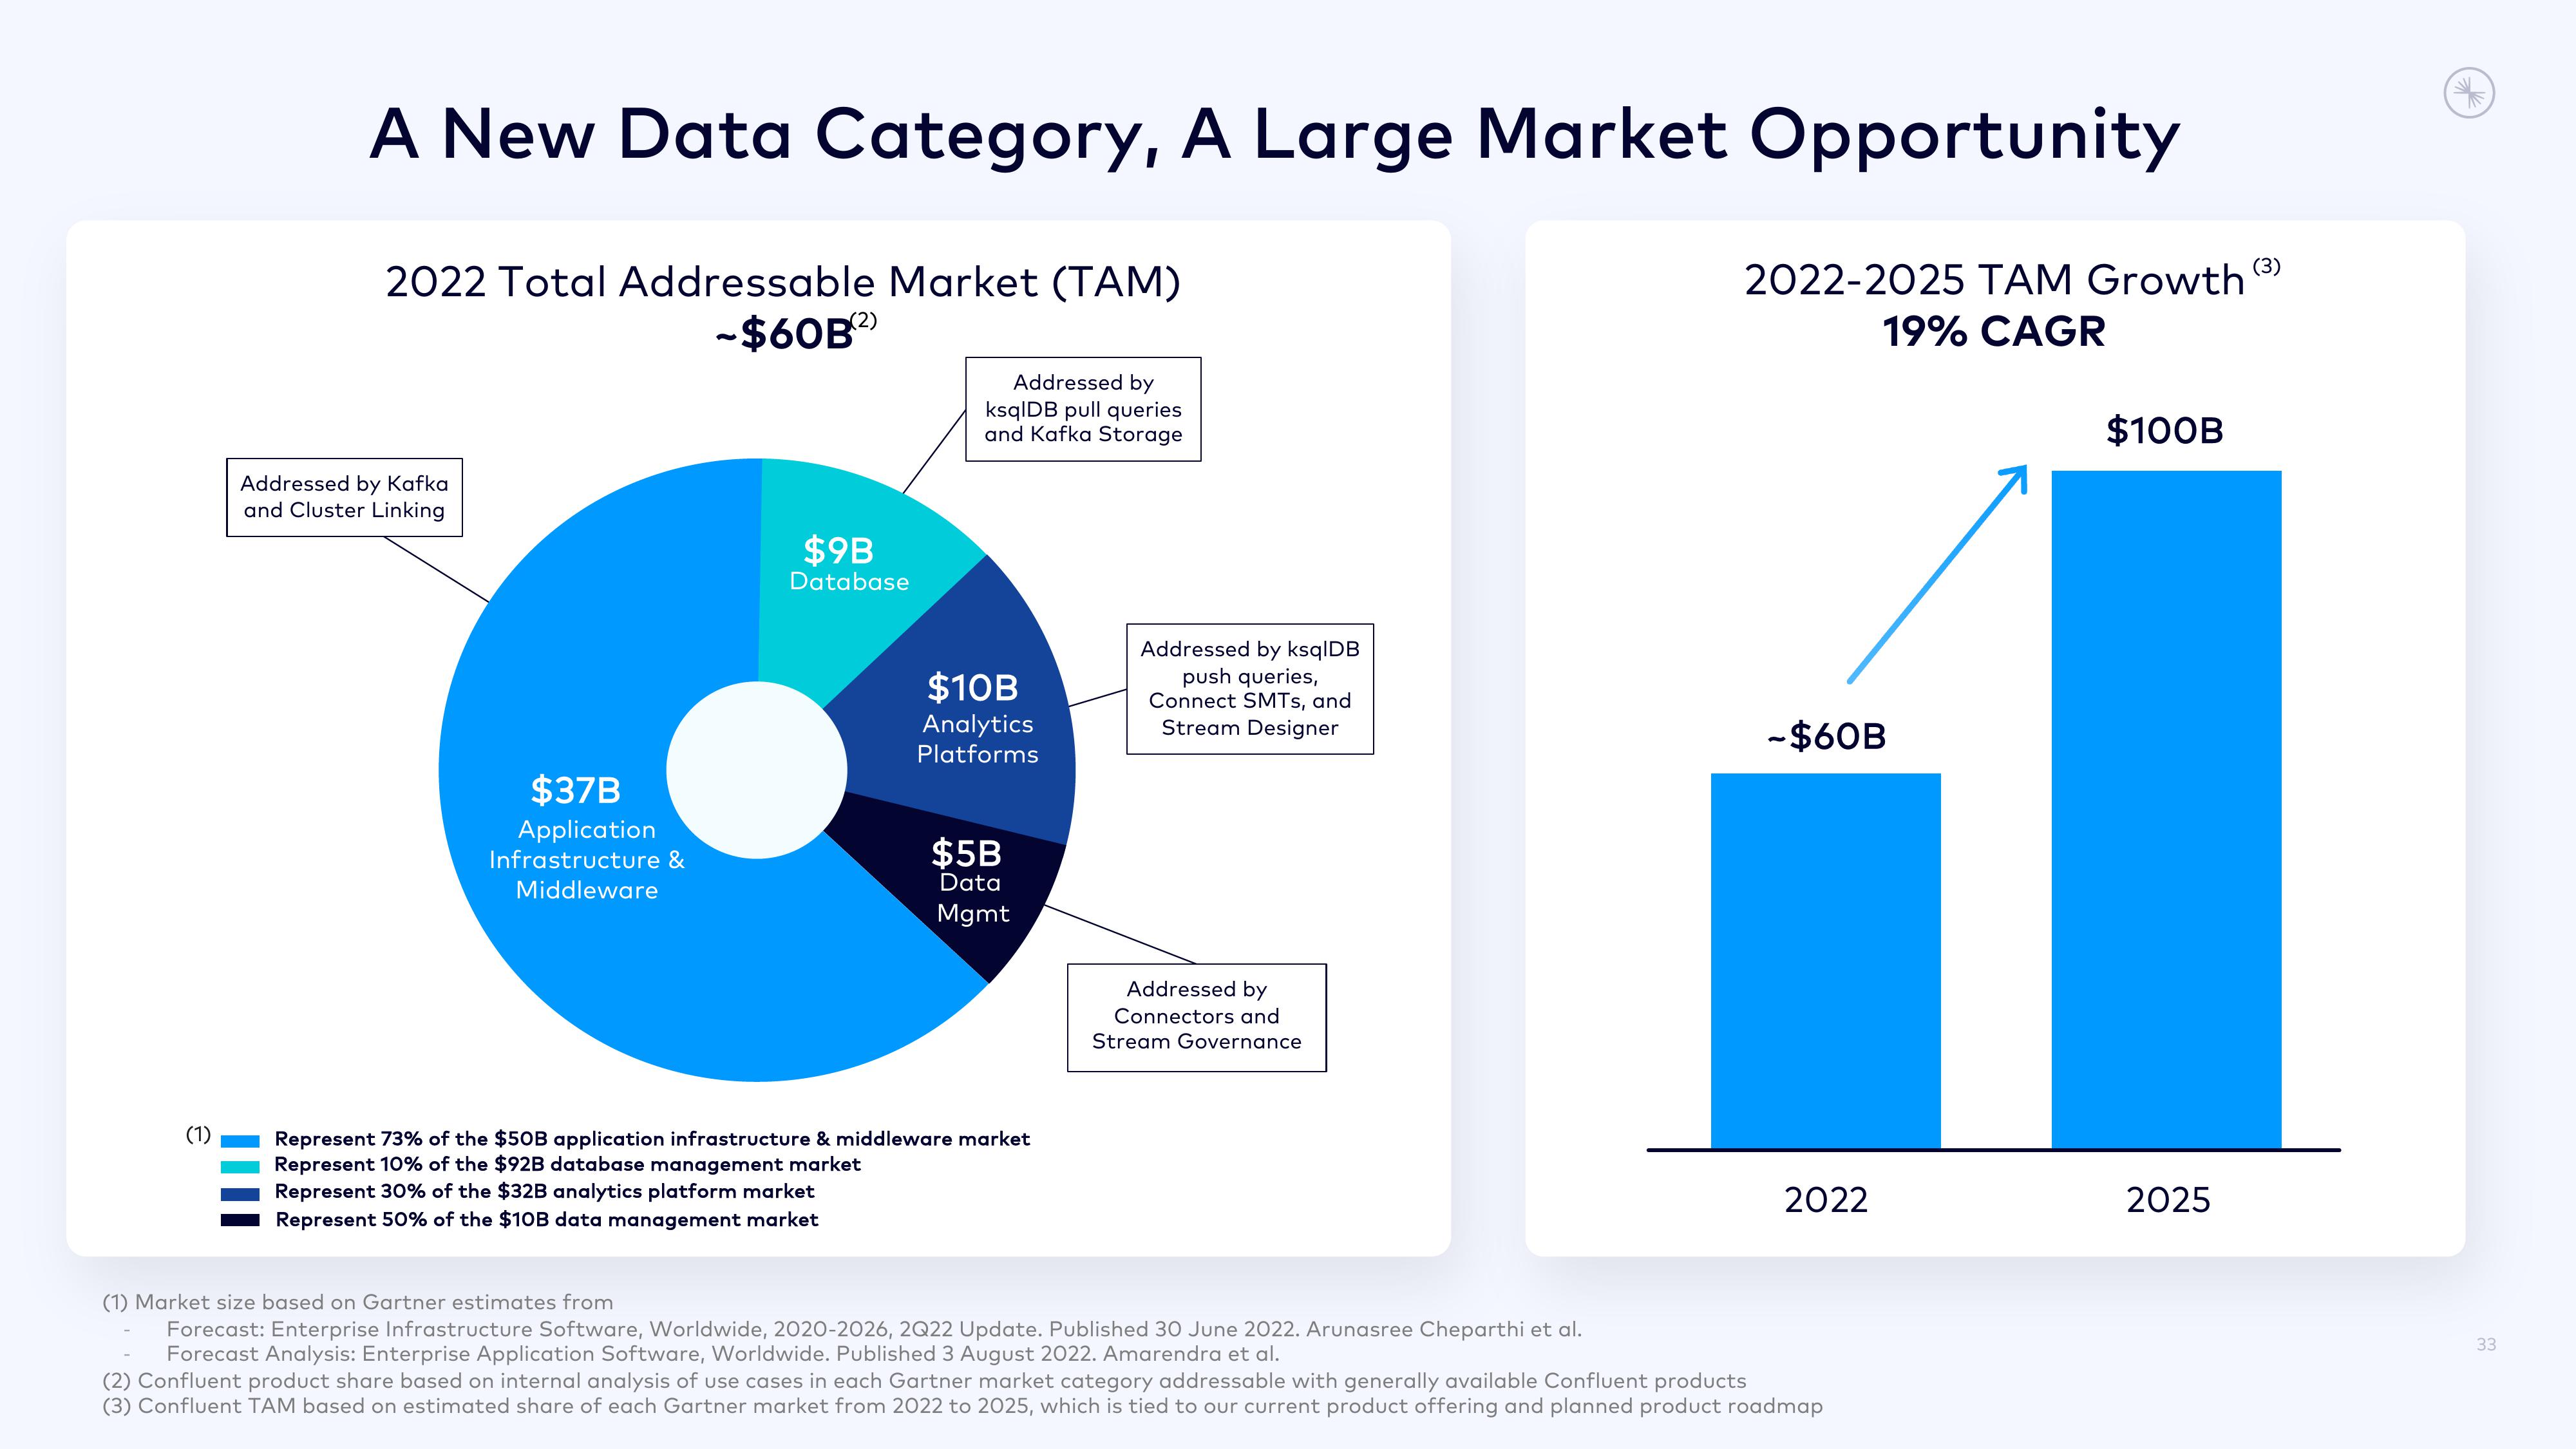
A New Data Category, A Large Market Opportunity
2022-2025 TAM Growth
19% CAGR
2022 Total Addressable Market (TAM)
-$60B(²)
Addressed by Kafka
and Cluster Linking
$37B
Application
Infrastructure &
Middleware
$9B
Database
Addressed by
ksqlDB pull queries
and Kafka Storage
$10B
Analytics
Platforms
$5B
Data
Mgmt
Represent 73% of the $50B application infrastructure & middleware market
Represent 10% of the $92B database management market
Represent 30% of the $32B analytics platform market
Represent 50% of the $10B data management market
Addressed by ksqlDB
push queries,
Connect SMTs, and
Stream Designer
Addressed by
Connectors and
Stream Governance
(1) Market size based on Gartner estimates from
Forecast: Enterprise Infrastructure Software, Worldwide, 2020-2026, 2Q22 Update. Published 30 June 2022. Arunasree Cheparthi et al.
Forecast Analysis: Enterprise Application Software, Worldwide. Published 3 August 2022. Amarendra et al.
-$60B
2022
(2) Confluent product share based on internal analysis of use cases in each Gartner market category addressable with generally available Confluent products
(3) Confluent TAM based on estimated share of each Gartner market from 2022 to 2025, which is tied to our current product offering and planned product roadmap
$100B
2025
(3)
33View entire presentation