Rent The Runway Results Presentation Deck
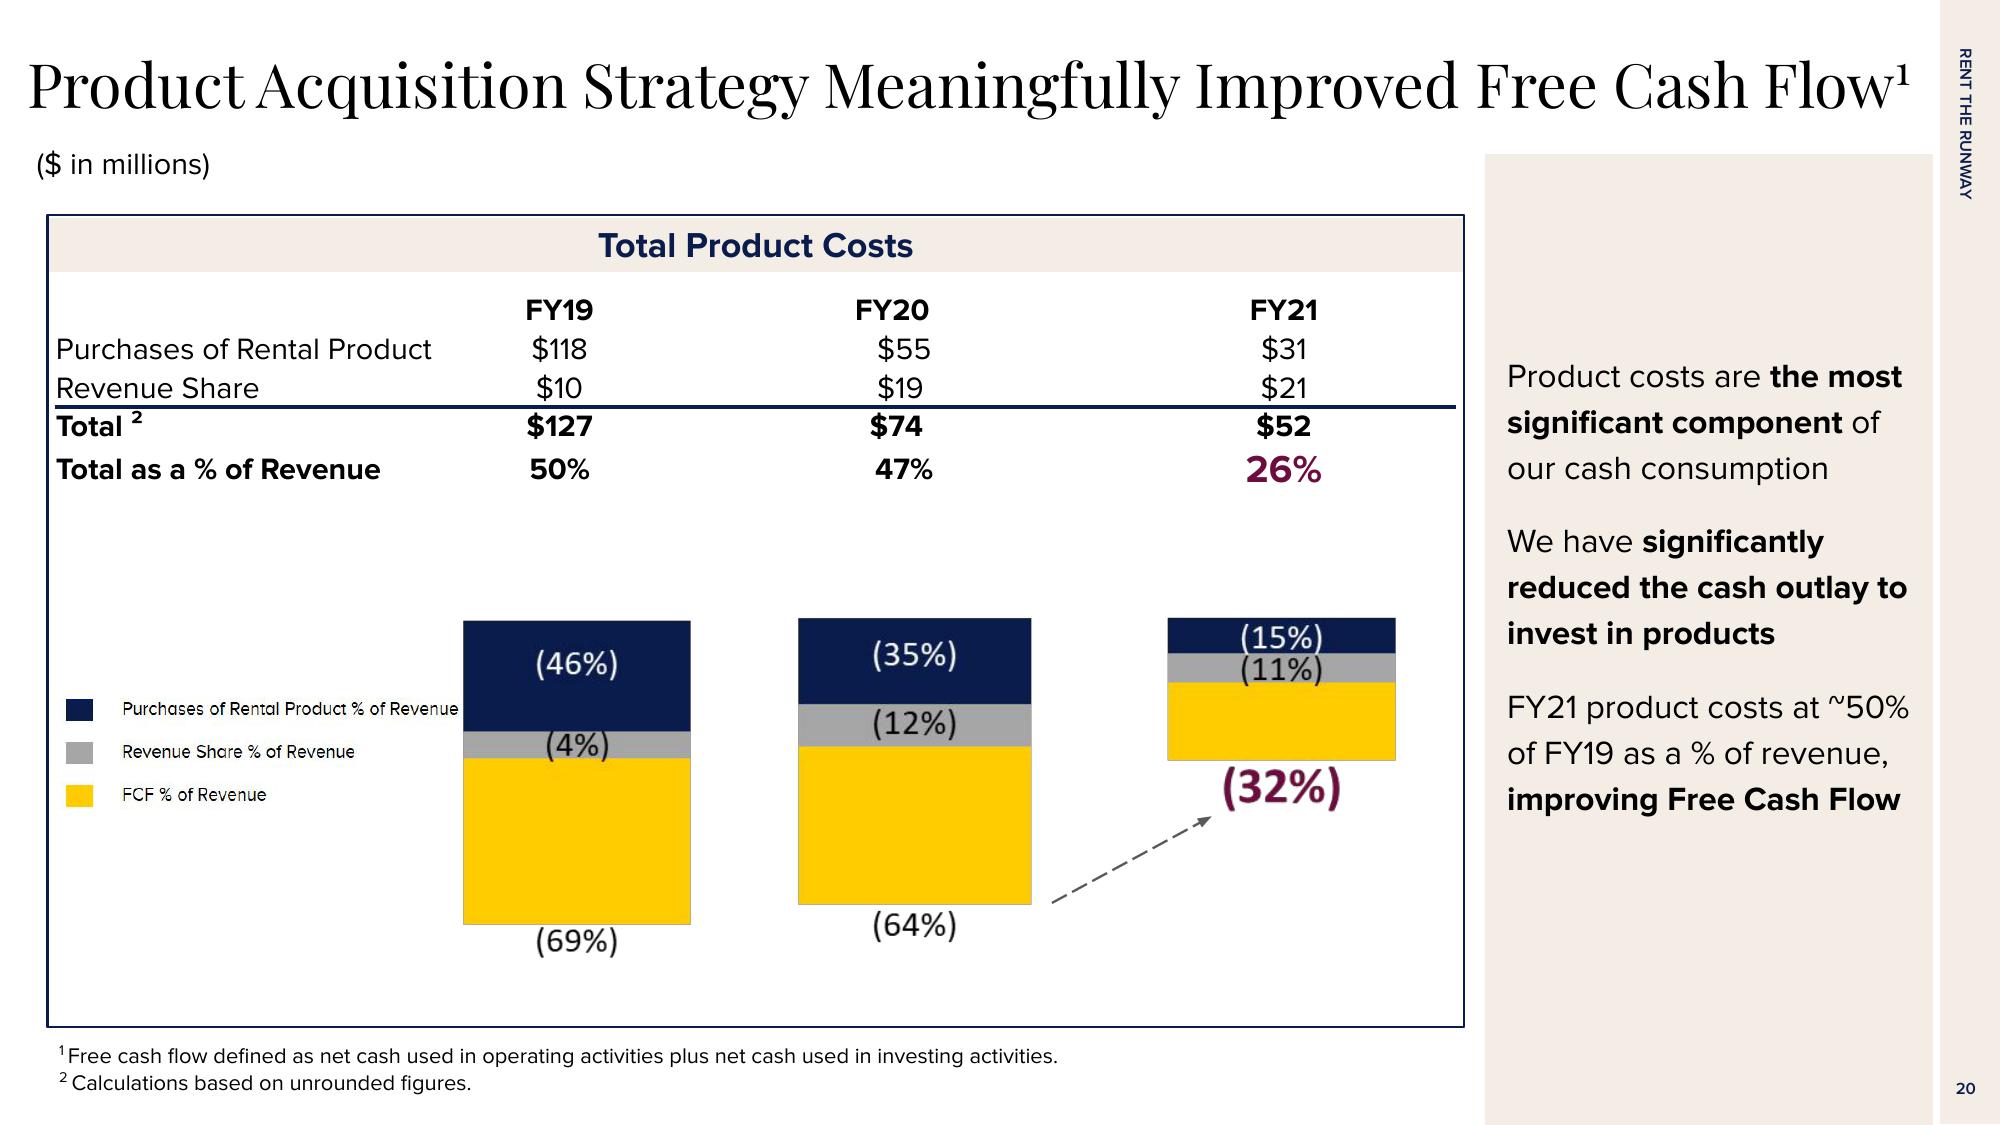
Product Acquisition Strategy Meaningfully Improved Free Cash Flow¹
($ in millions)
Purchases of Rental Product
Revenue Share
Total 2
Total as a % of Revenue
Purchases of Rental Product % of Revenue
Revenue Share % of Revenue
FCF % of Revenue
FY19
$118
$10
$127
50%
Total Product Costs
(46%)
(4%)
(69%)
FY20
$55
$19
$74
47%
(35%)
(12%)
(64%)
¹Free cash flow defined as net cash used in operating activities plus net cash used in investing activities.
2 Calculations based on unrounded figures.
FY21
$31
$21
$52
26%
(15%)
(11%)
(32%)
Product costs are the most
significant component of
our cash consumption
We have significantly
reduced the cash outlay to
invest in products
FY21 product costs at ~50%
of FY19 as a % of revenue,
improving Free Cash Flow
RENT THE RUNWAY
20View entire presentation