First Watch IPO Presentation Deck
6
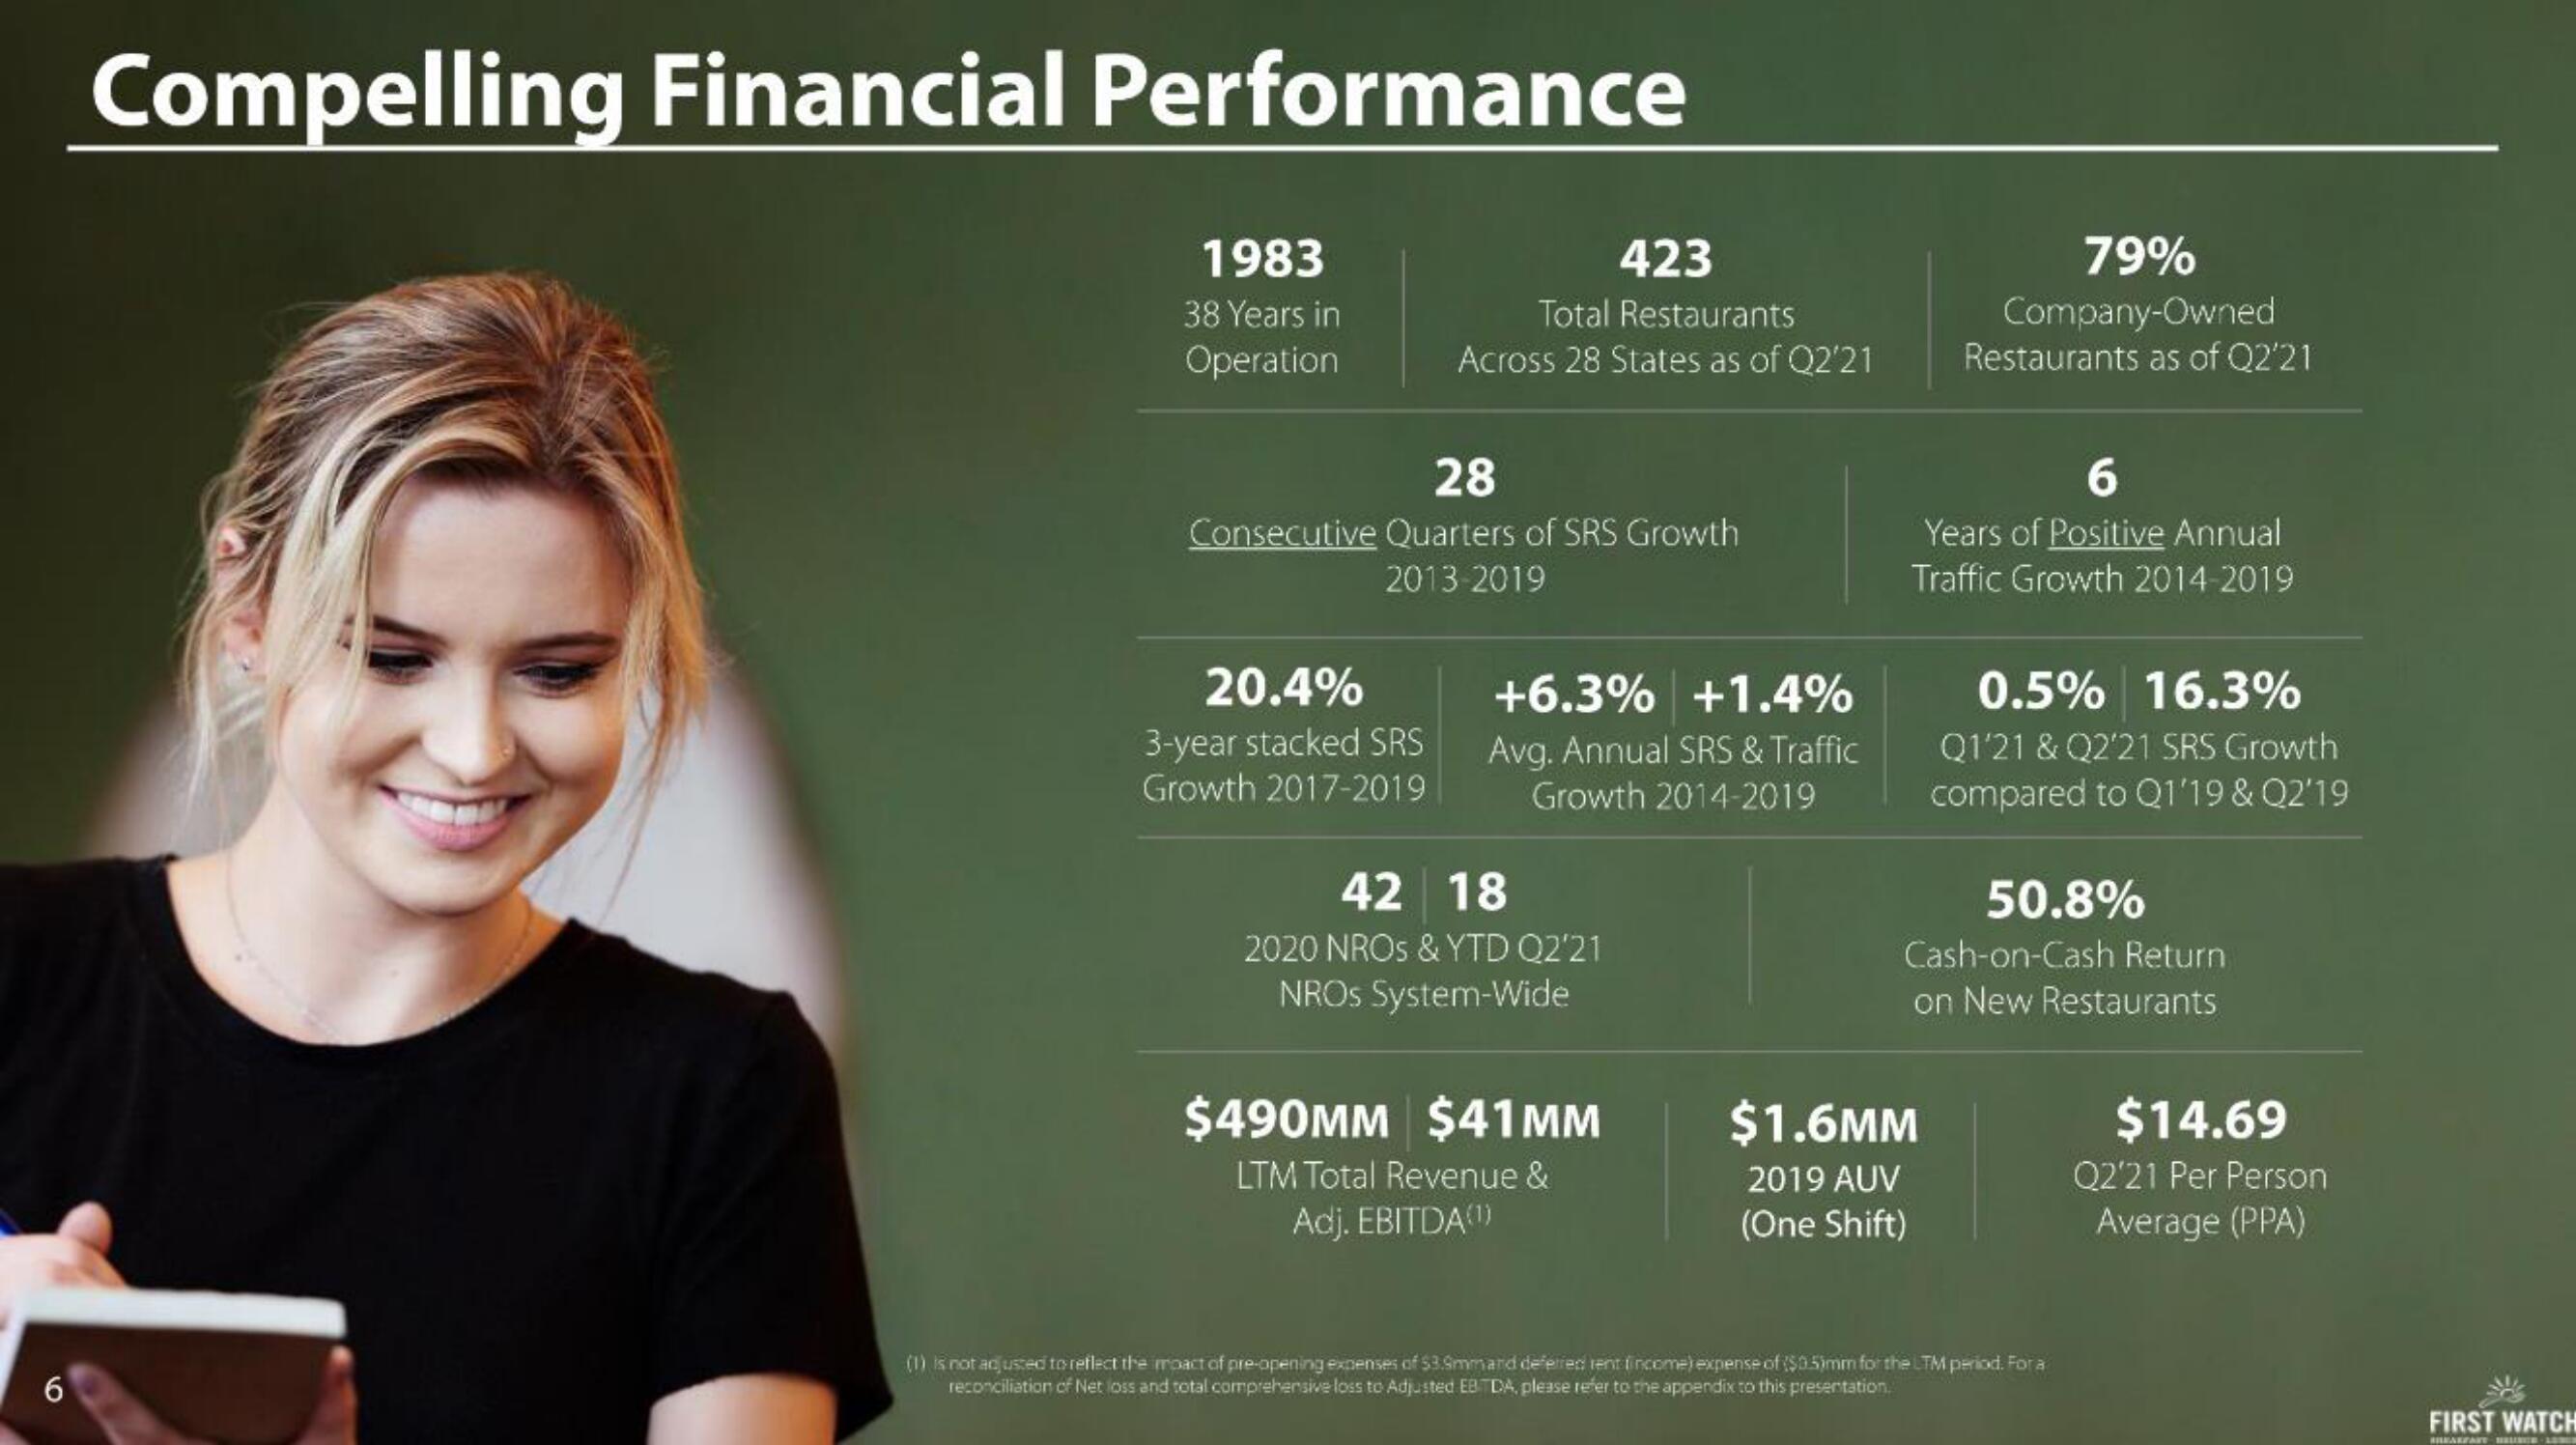
Compelling Financial Performance
1983
38 Years in
Operation
423
Total Restaurants
Across 28 States as of Q2'21
28
Consecutive Quarters of SRS Growth
2013-2019
20.4%
3-year stacked SRS
Growth 2017-2019
+6.3% +1.4%
Avg. Annual SRS & Traffic
Growth 2014-2019
42 18
2020 NROS & YTD Q2'21
NROS System-Wide
$490MM $41MM
LTM Total Revenue &
Adj. EBITDA(1)
79%
Company-Owned
Restaurants as of Q2'21
6
Years of Positive Annual
Traffic Growth 2014-2019
$1.6MM
2019 AUV
(One Shift)
0.5% 16.3%
Q1'21 & Q2'21 SRS Growth
compared to Q1'19 & Q2'19
50.8%
Cash-on-Cash Return
on New Restaurants
(1) is not adjusted to reflect the moact of pre-opening expenses of $3.9mmard deferred rent (income) expense of ($0.5)mm for the LTM period. For a
reconciliation of Net loss and total comprehensive loss to Adjusted EBITDA, please refer to the appendix to this presentation.
$14.69
Q2'21 Per Person
Average (PPA)
FIRST WATCH
BREAKFART BELINE - LONENView entire presentation