Kering Investor Presentation Deck
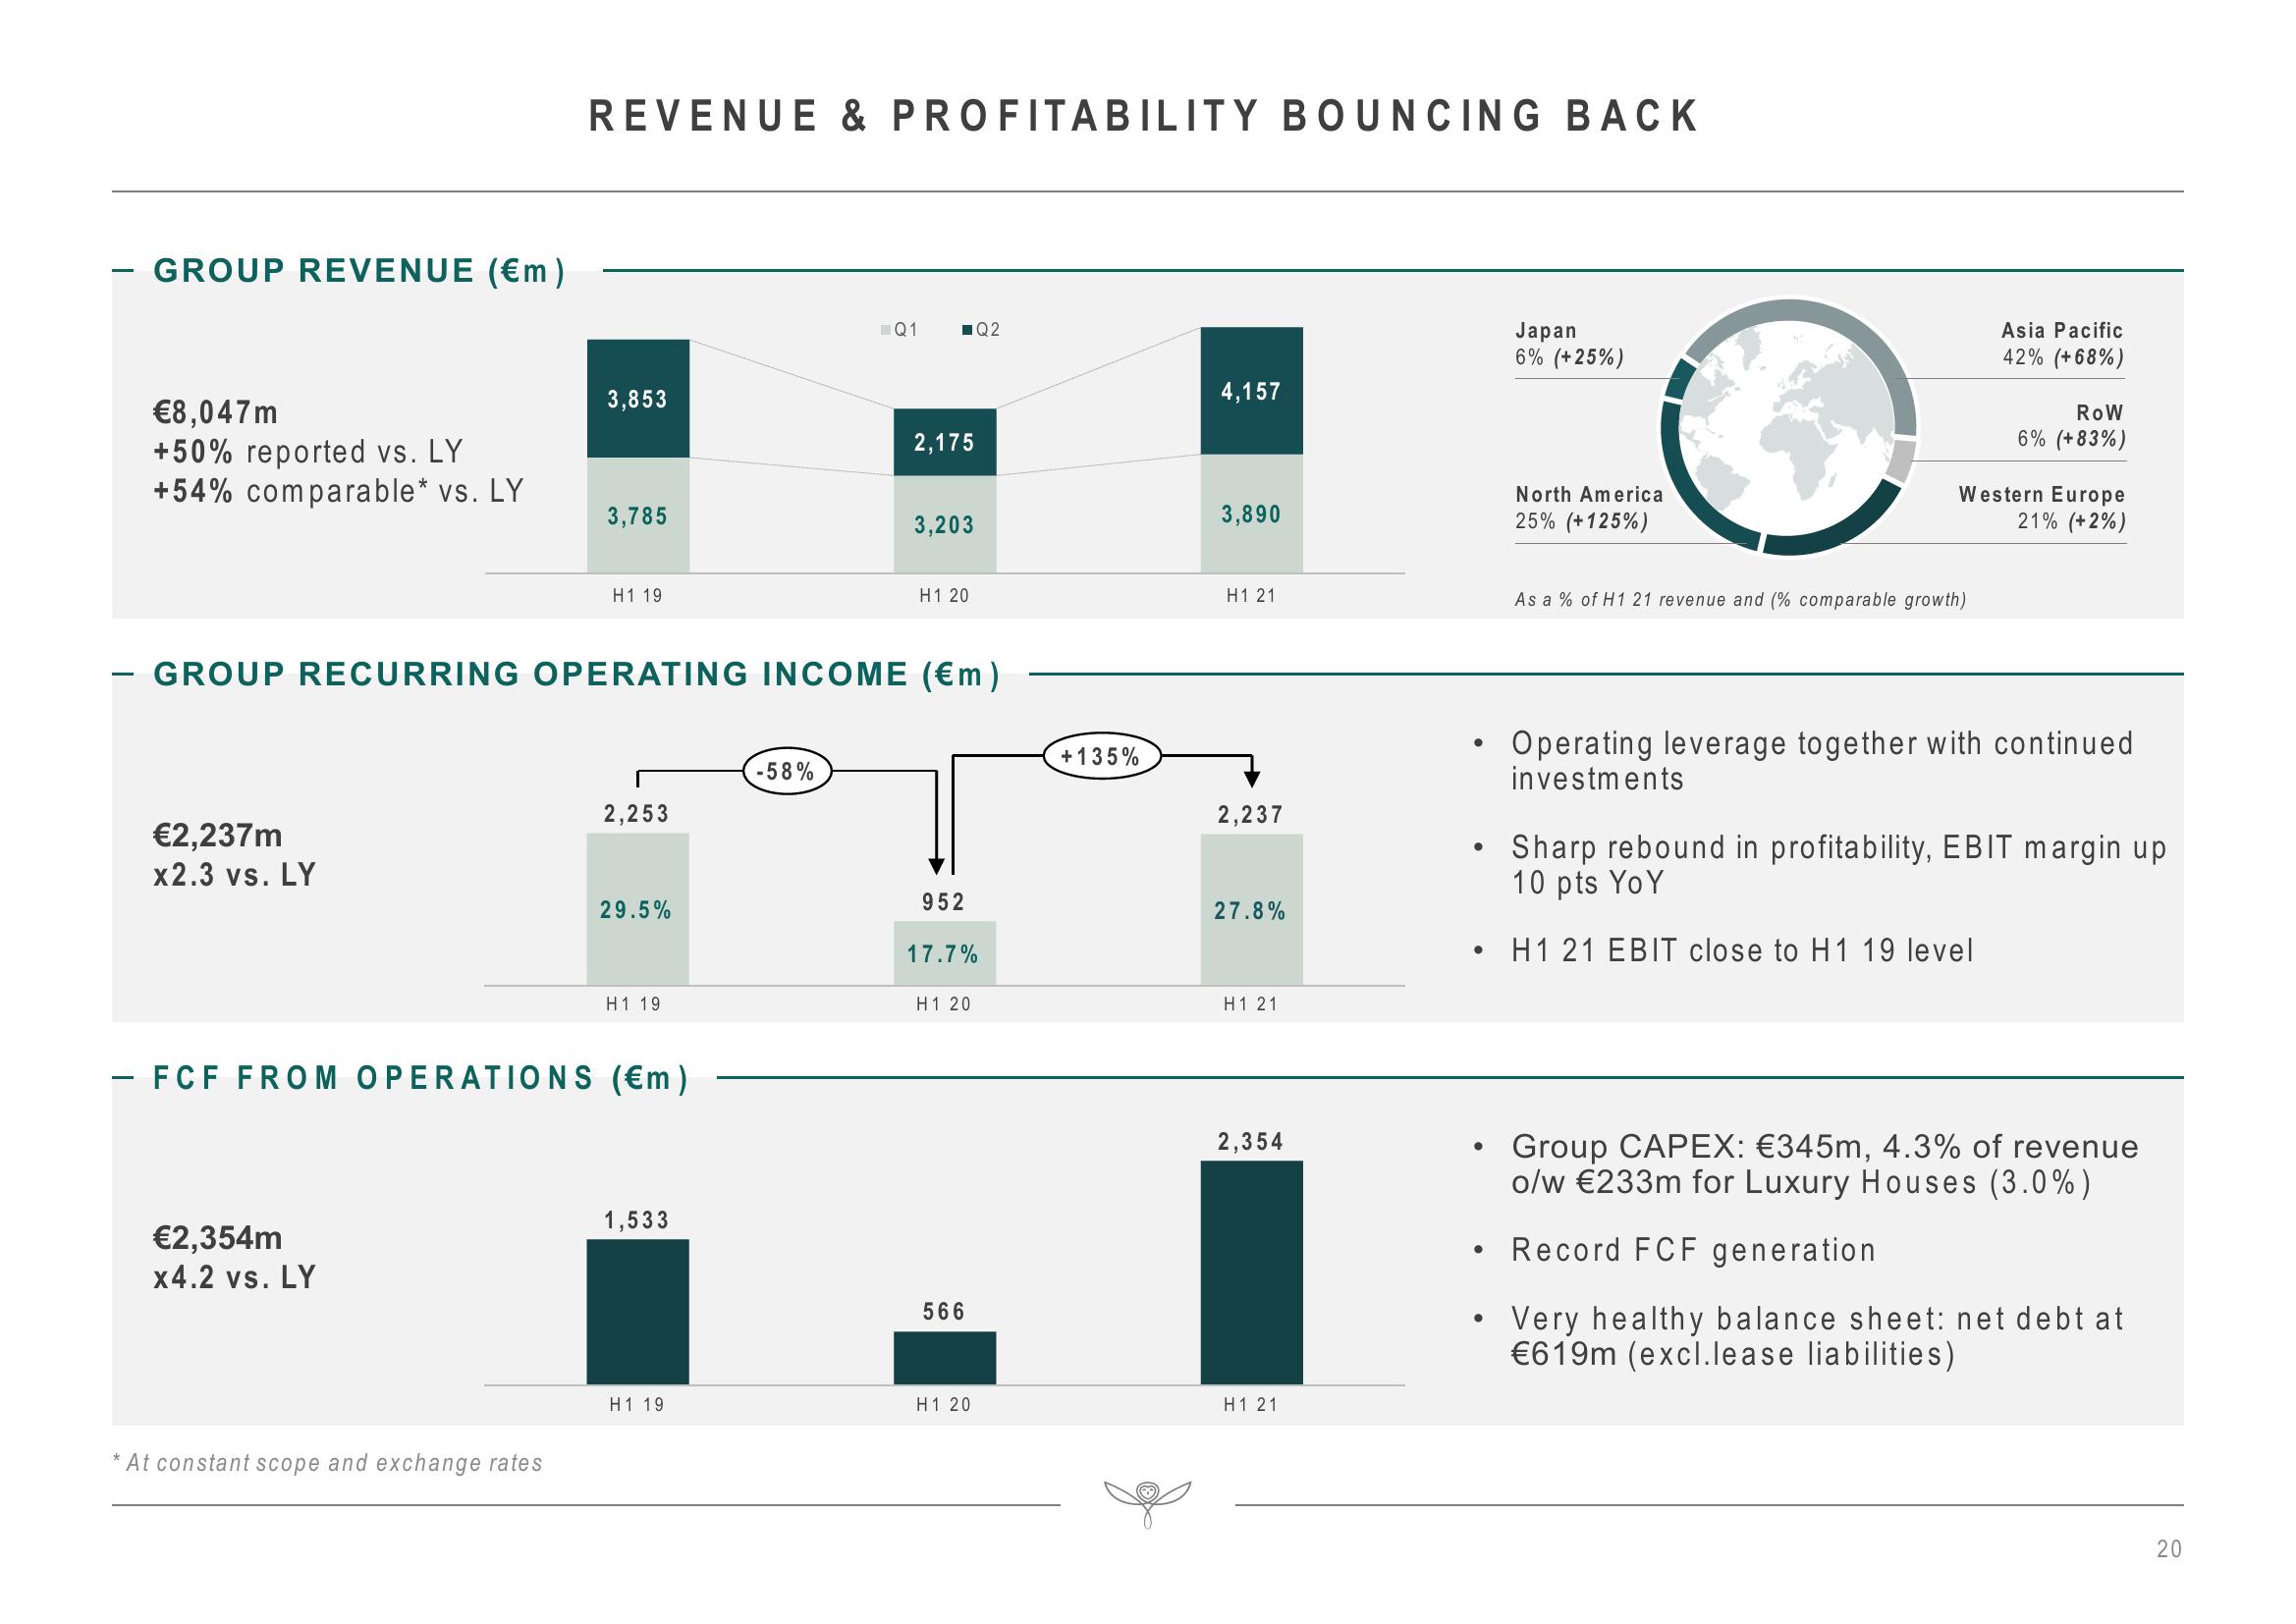
GROUP REVENUE (€m)
€8,047m
+50% reported vs. LY
+54% comparable* vs. LY
€2,237m
x2.3 vs. LY
REVENUE & PROFITABILITY BOUNCING BACK
€2,354m
x4.2 vs. LY
3,853
* At constant scope and exchange rates
3,785
H119
GROUP RECURRING OPERATING INCOME (€m)
2,253
29.5%
- FCF FROM OPERATIONS (€m)
H119
1,533
H 1 19
Q1 ■Q2
-58%
2,175
3,203
H1 20
952
17.7%
H1 20
566
H120
+ 135%
4,157
3,890
H121
2,237
27.8%
H121
2,354
H121
●
●
●
●
●
●
Japan
6% (+25%)
North America
25% (+125%)
Asia Pacific
42% (+68%)
As a % of H1 21 revenue and (% comparable growth)
ROW
6% (+83%)
Western Europe
21% (+2%)
Operating leverage together with continued
investments
Sharp rebound in profitability, EBIT margin up
10 pts YoY
H1 21 EBIT close to H1 19 level
Group CAPEX: €345m, 4.3% of revenue
o/w €233m for Luxury Houses (3.0%)
Record FCF generation
Very healthy balance sheet: net debt at
€619m (excl.lease liabilities)
20View entire presentation