Yatsen Results Presentation Deck
Operating Expenses
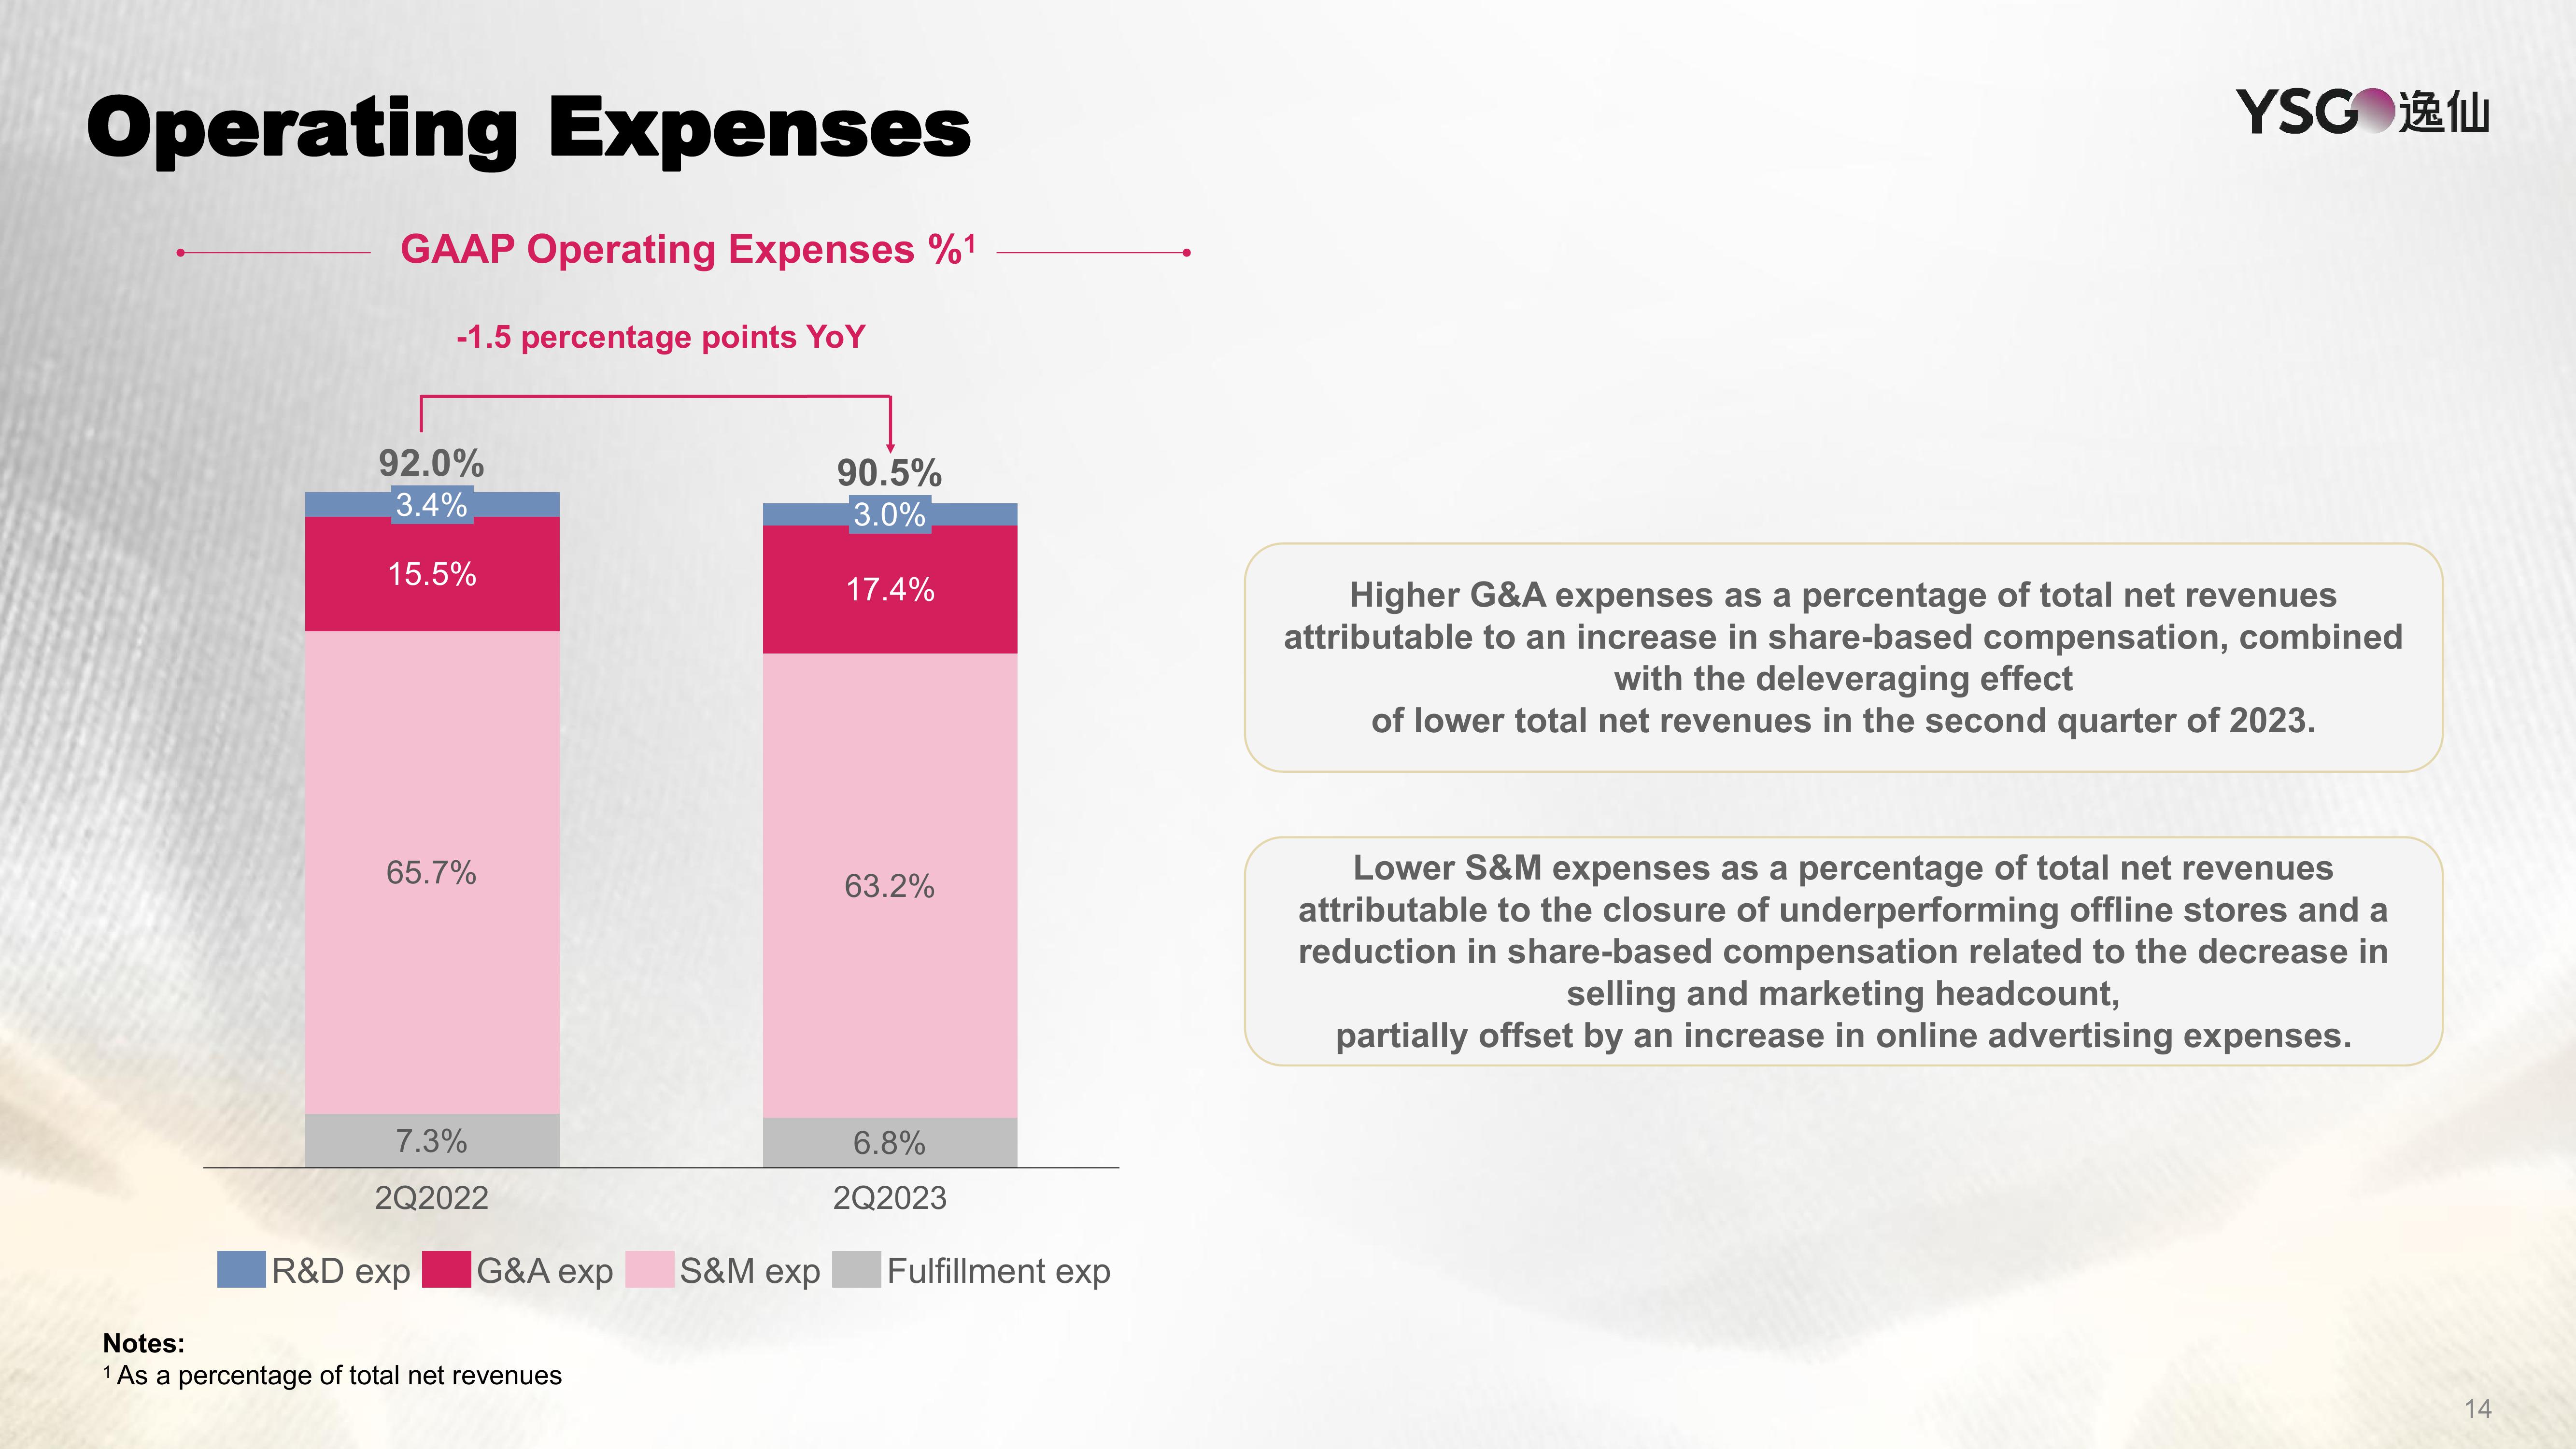
GAAP Operating Expenses %¹
-1.5 percentage points YoY
92.0%
3.4%
15.5%
65.7%
7.3%
2Q2022
R&D exp
G&A exp
Notes:
1 As a percentage of total net revenues
S&M exp
90.5%
3.0%
17.4%
63.2%
6.8%
2Q2023
Fulfillment exp
YSG1L
Higher G&A expenses as a percentage of total net revenues
attributable to an increase in share-based compensation, combined
with the deleveraging effect
of lower total net revenues in the second quarter of 2023.
Lower S&M expenses as a percentage of total net revenues
attributable to the closure of underperforming offline stores and a
reduction in share-based compensation related to the decrease in
selling and marketing headcount,
partially offset by an increase in online advertising expenses.
14View entire presentation