Sonos Results Presentation Deck
Strong Revenue Growth While Investing in the Future
Q1 Revenue
$645.6
CC: +12%
Reported: +15%
1Q21
Americas (57% of sales): +21% y/y
EMEA (37% of sales): +13% y/y
APAC (6% of sales): -17% y/y
Q1 Adjusted EBITDA
$166.3
25.8% margin
1Q21
$664.5
CC: +4%
Reported: +3%
1Q22
Americas (56% of sales): +2% y/y
EMEA (37% of sales): +2% y/y
APAC (7% of sales): +18% y/y
$163.1
24.6% margin
1Q22
$672.6
CC: +7%
Reported: +1%
1Q23
Americas (59% of sales): +6% y/y
EMEA (36% of sales): -2% y/y
APAC (5% of sales): -21% y/y
$123.9
18.4% margin
1Q23
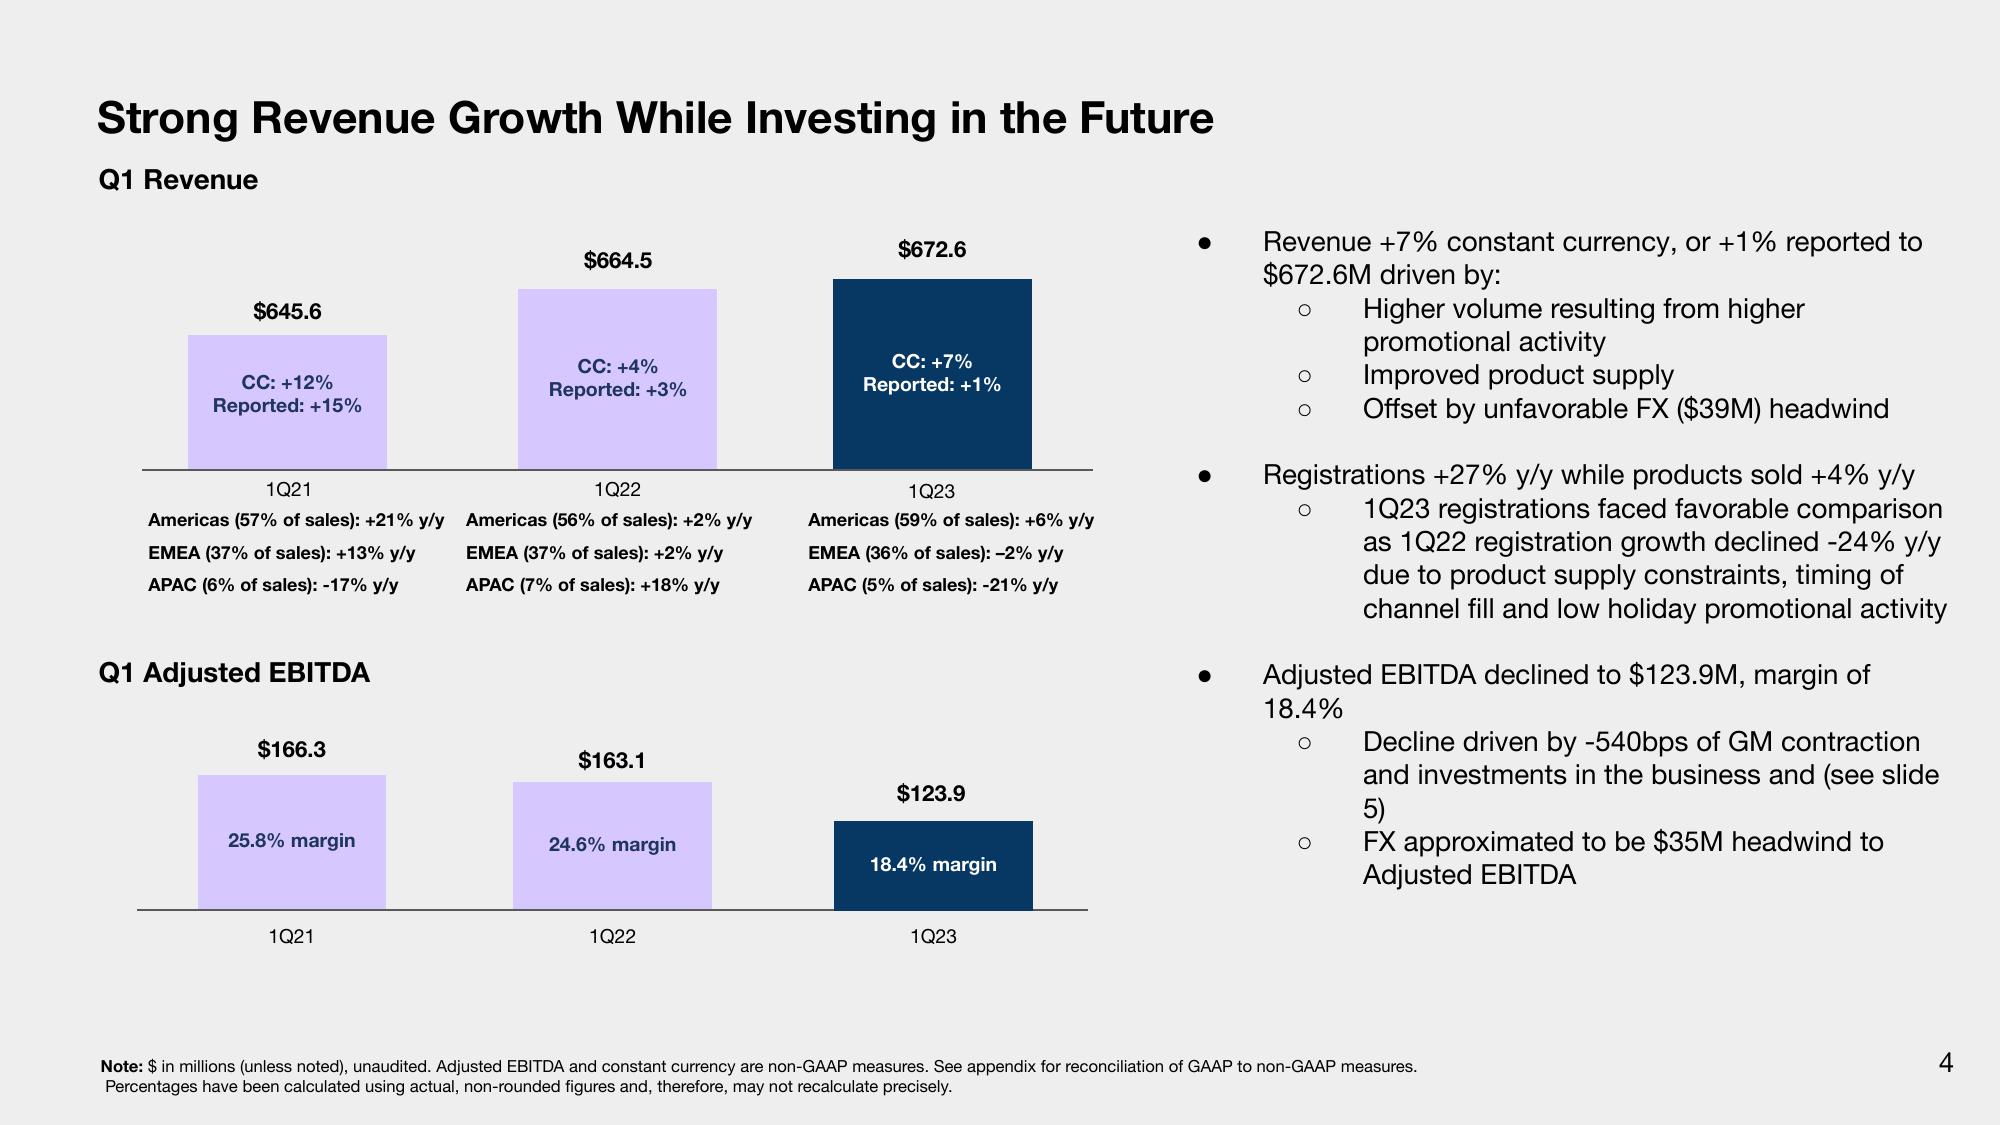
Revenue +7% constant currency, or +1% reported to
$672.6M driven by:
O
Higher volume resulting from higher
Registrations +27% y/y while products sold +4% y/y
1Q23 registrations faced favorable comparison
as 1Q22 registration growth declined -24% y/y
due to product supply constraints, timing of
channel fill and low holiday promotional activity
O
promotional activity
Improved product supply
Offset by unfavorable FX ($39M) headwind
Adjusted EBITDA declined to $123.9M, margin of
18.4%
O
O
Decline driven by -540bps of GM contraction
and investments in the business and (see slide
5)
FX approximated to be $35M headwind to
Adjusted
Note: $ in millions (unless noted), unaudited. Adjusted EBITDA and constant currency are non-GAAP measures. See appendix for reconciliation of GAAP to non-GAAP measures.
Percentages have been calculated using actual, non-rounded figures and, therefore, may not recalculate precisely.
4View entire presentation