BlackRock Results Presentation Deck
$300
162.2 161.4 160.5 159.3
Q2
2018
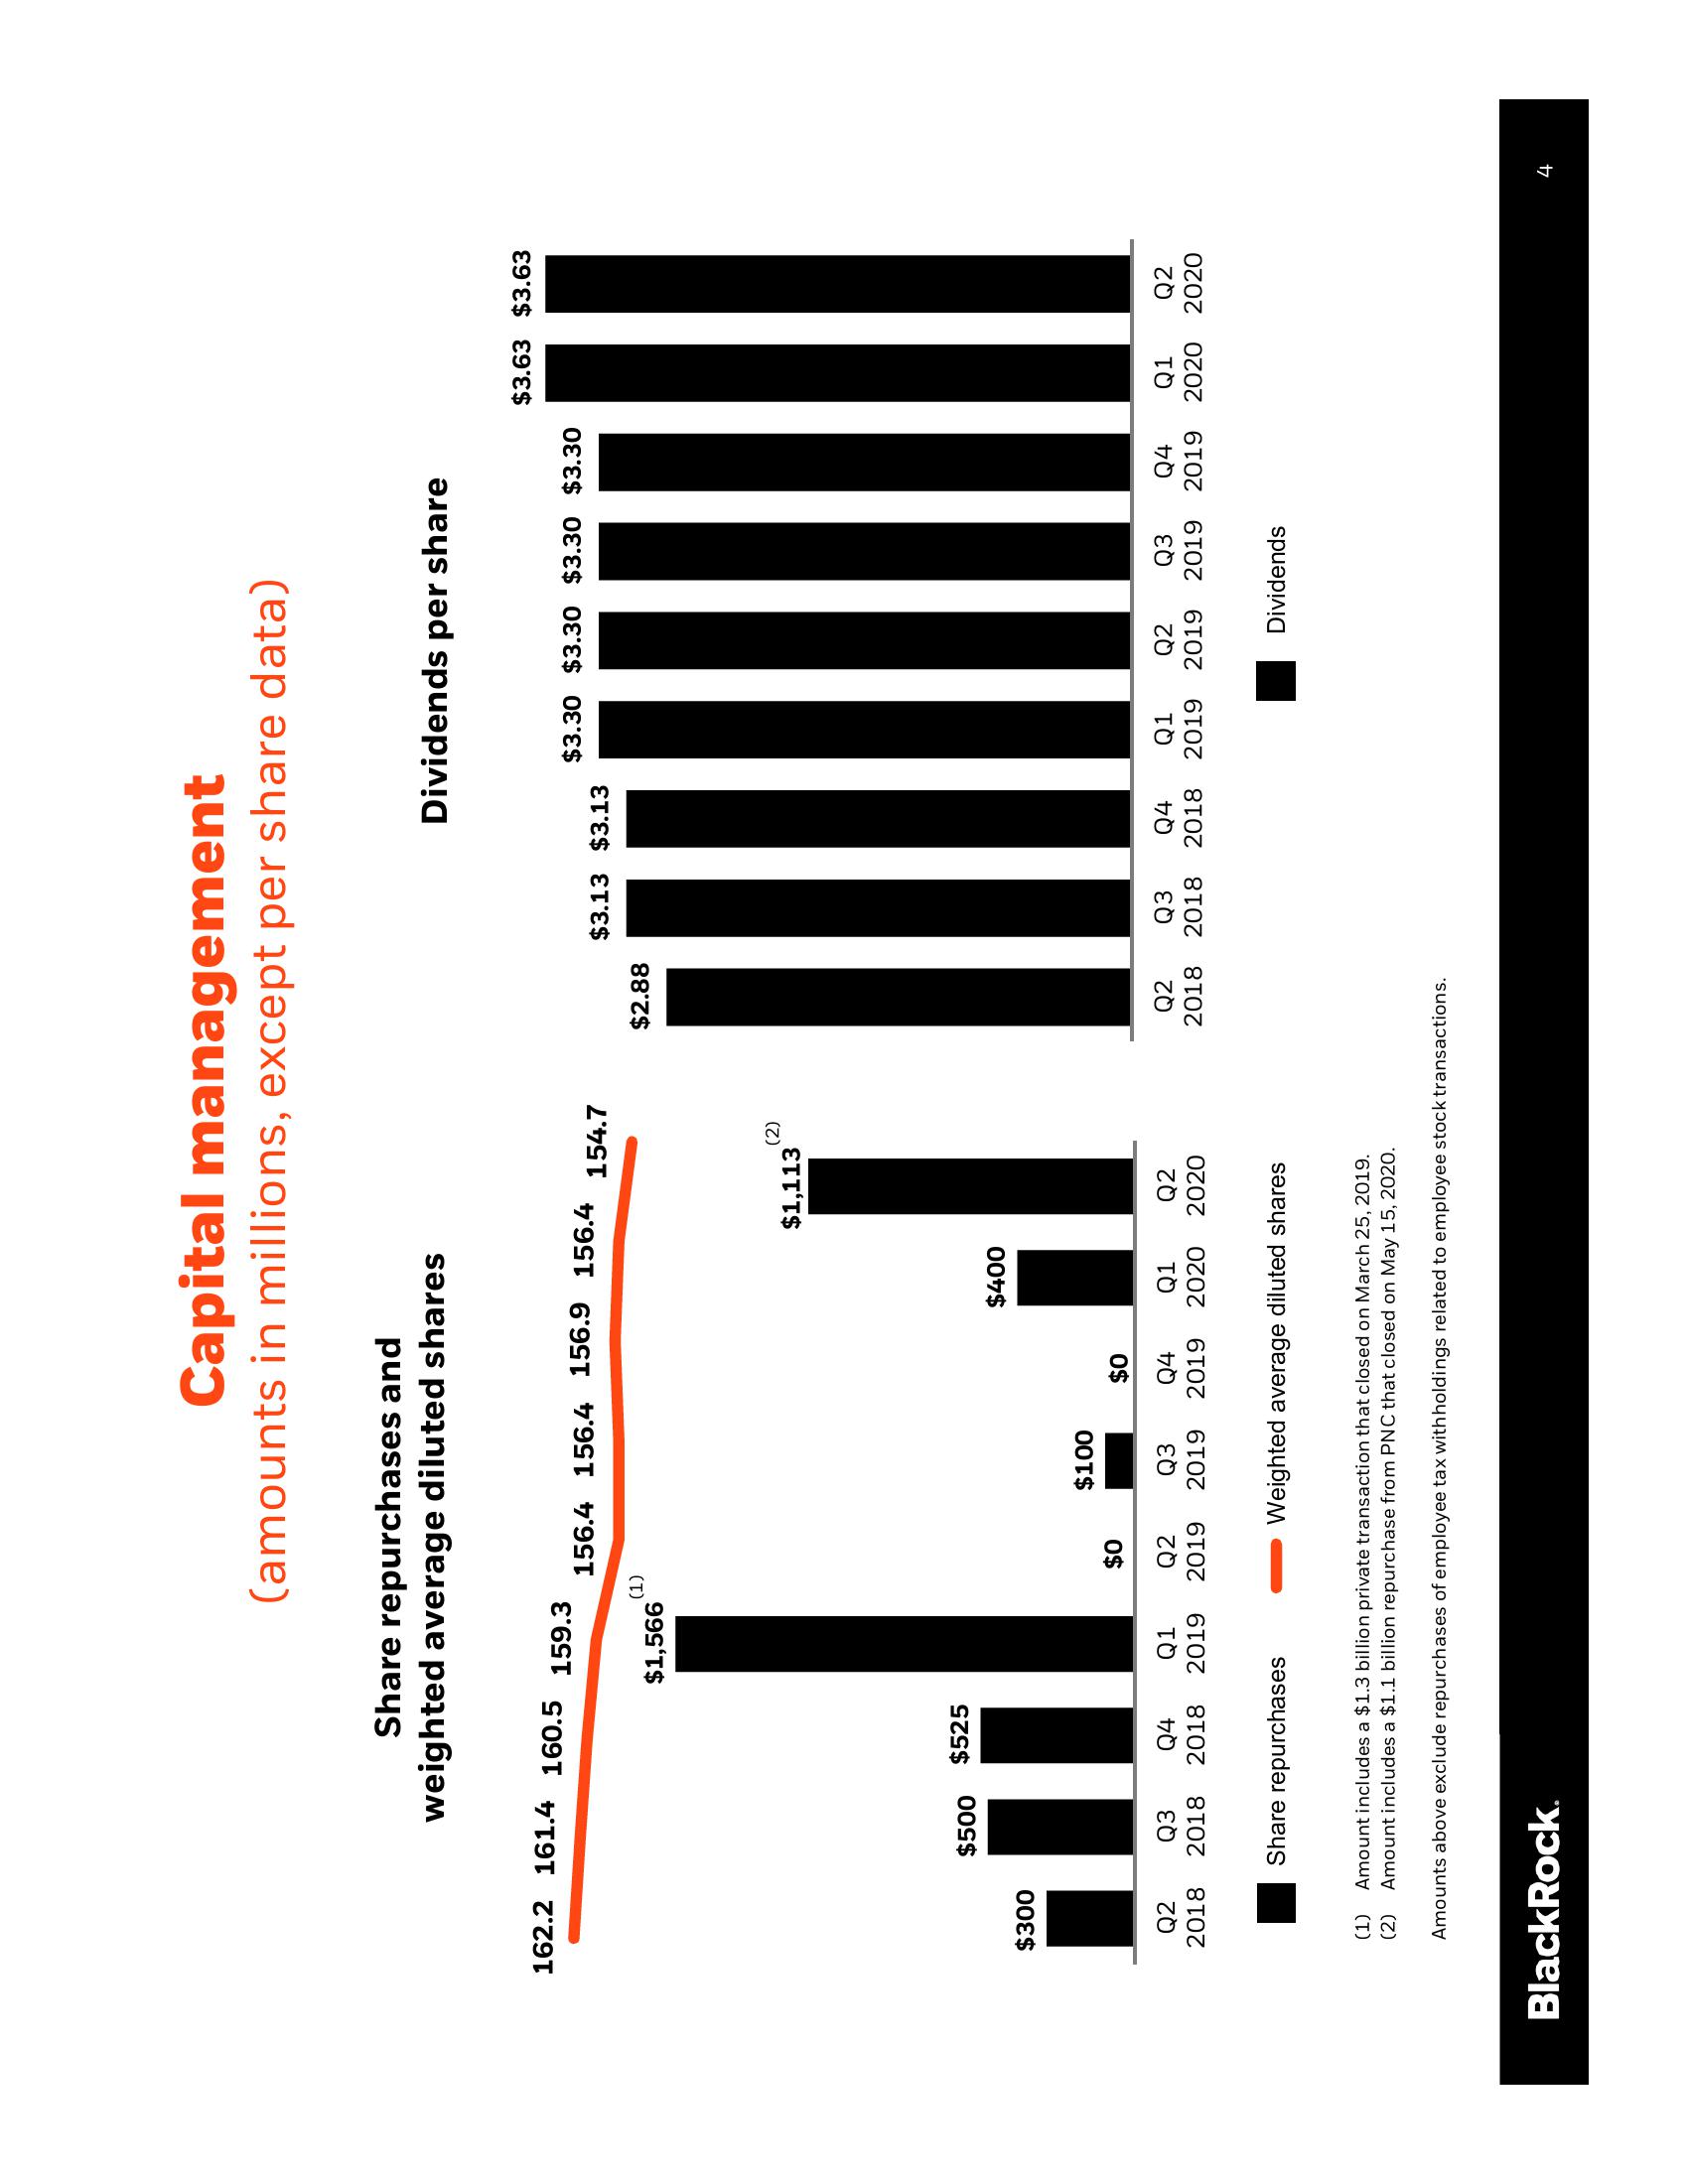
Share repurchases and
weighted average diluted shares
$500
Sha
$525
Q3 Q4
Q1
2018 2018 2019
Capital management
(amounts in millions, except per share data)
BlackRock.
$1,566
repurchases
156.4 156.4 156.9 156.4 154.7
(1)
$0
Q2
2019
$100
$400
$1,113
$0
Q3 Q4 Q1
Q2
2019 2019 2020 2020
(2)
Weighted average diluted shares
$2.88
(1) Amount includes a $1.3 billion private transaction that closed on March 25, 2019.
(2) Amount includes a $1.1 billion repurchase from PNC that closed on May 15, 2020.
Amounts above exclude repurchases of employee tax withholdings related to employee stock transactions.
Q2 Q3
2018
Dividends per share
$3.13 $3.13
$3.30 $3.30 $3.30 $3.30
Q4 Q1 Q2 Q3
2018 2018 2019 2019 2019
Dividends
$3.63 $3.63
Q4 Q1 Q2
2019 2020 2020
4View entire presentation