JD Sports Results Presentation Deck
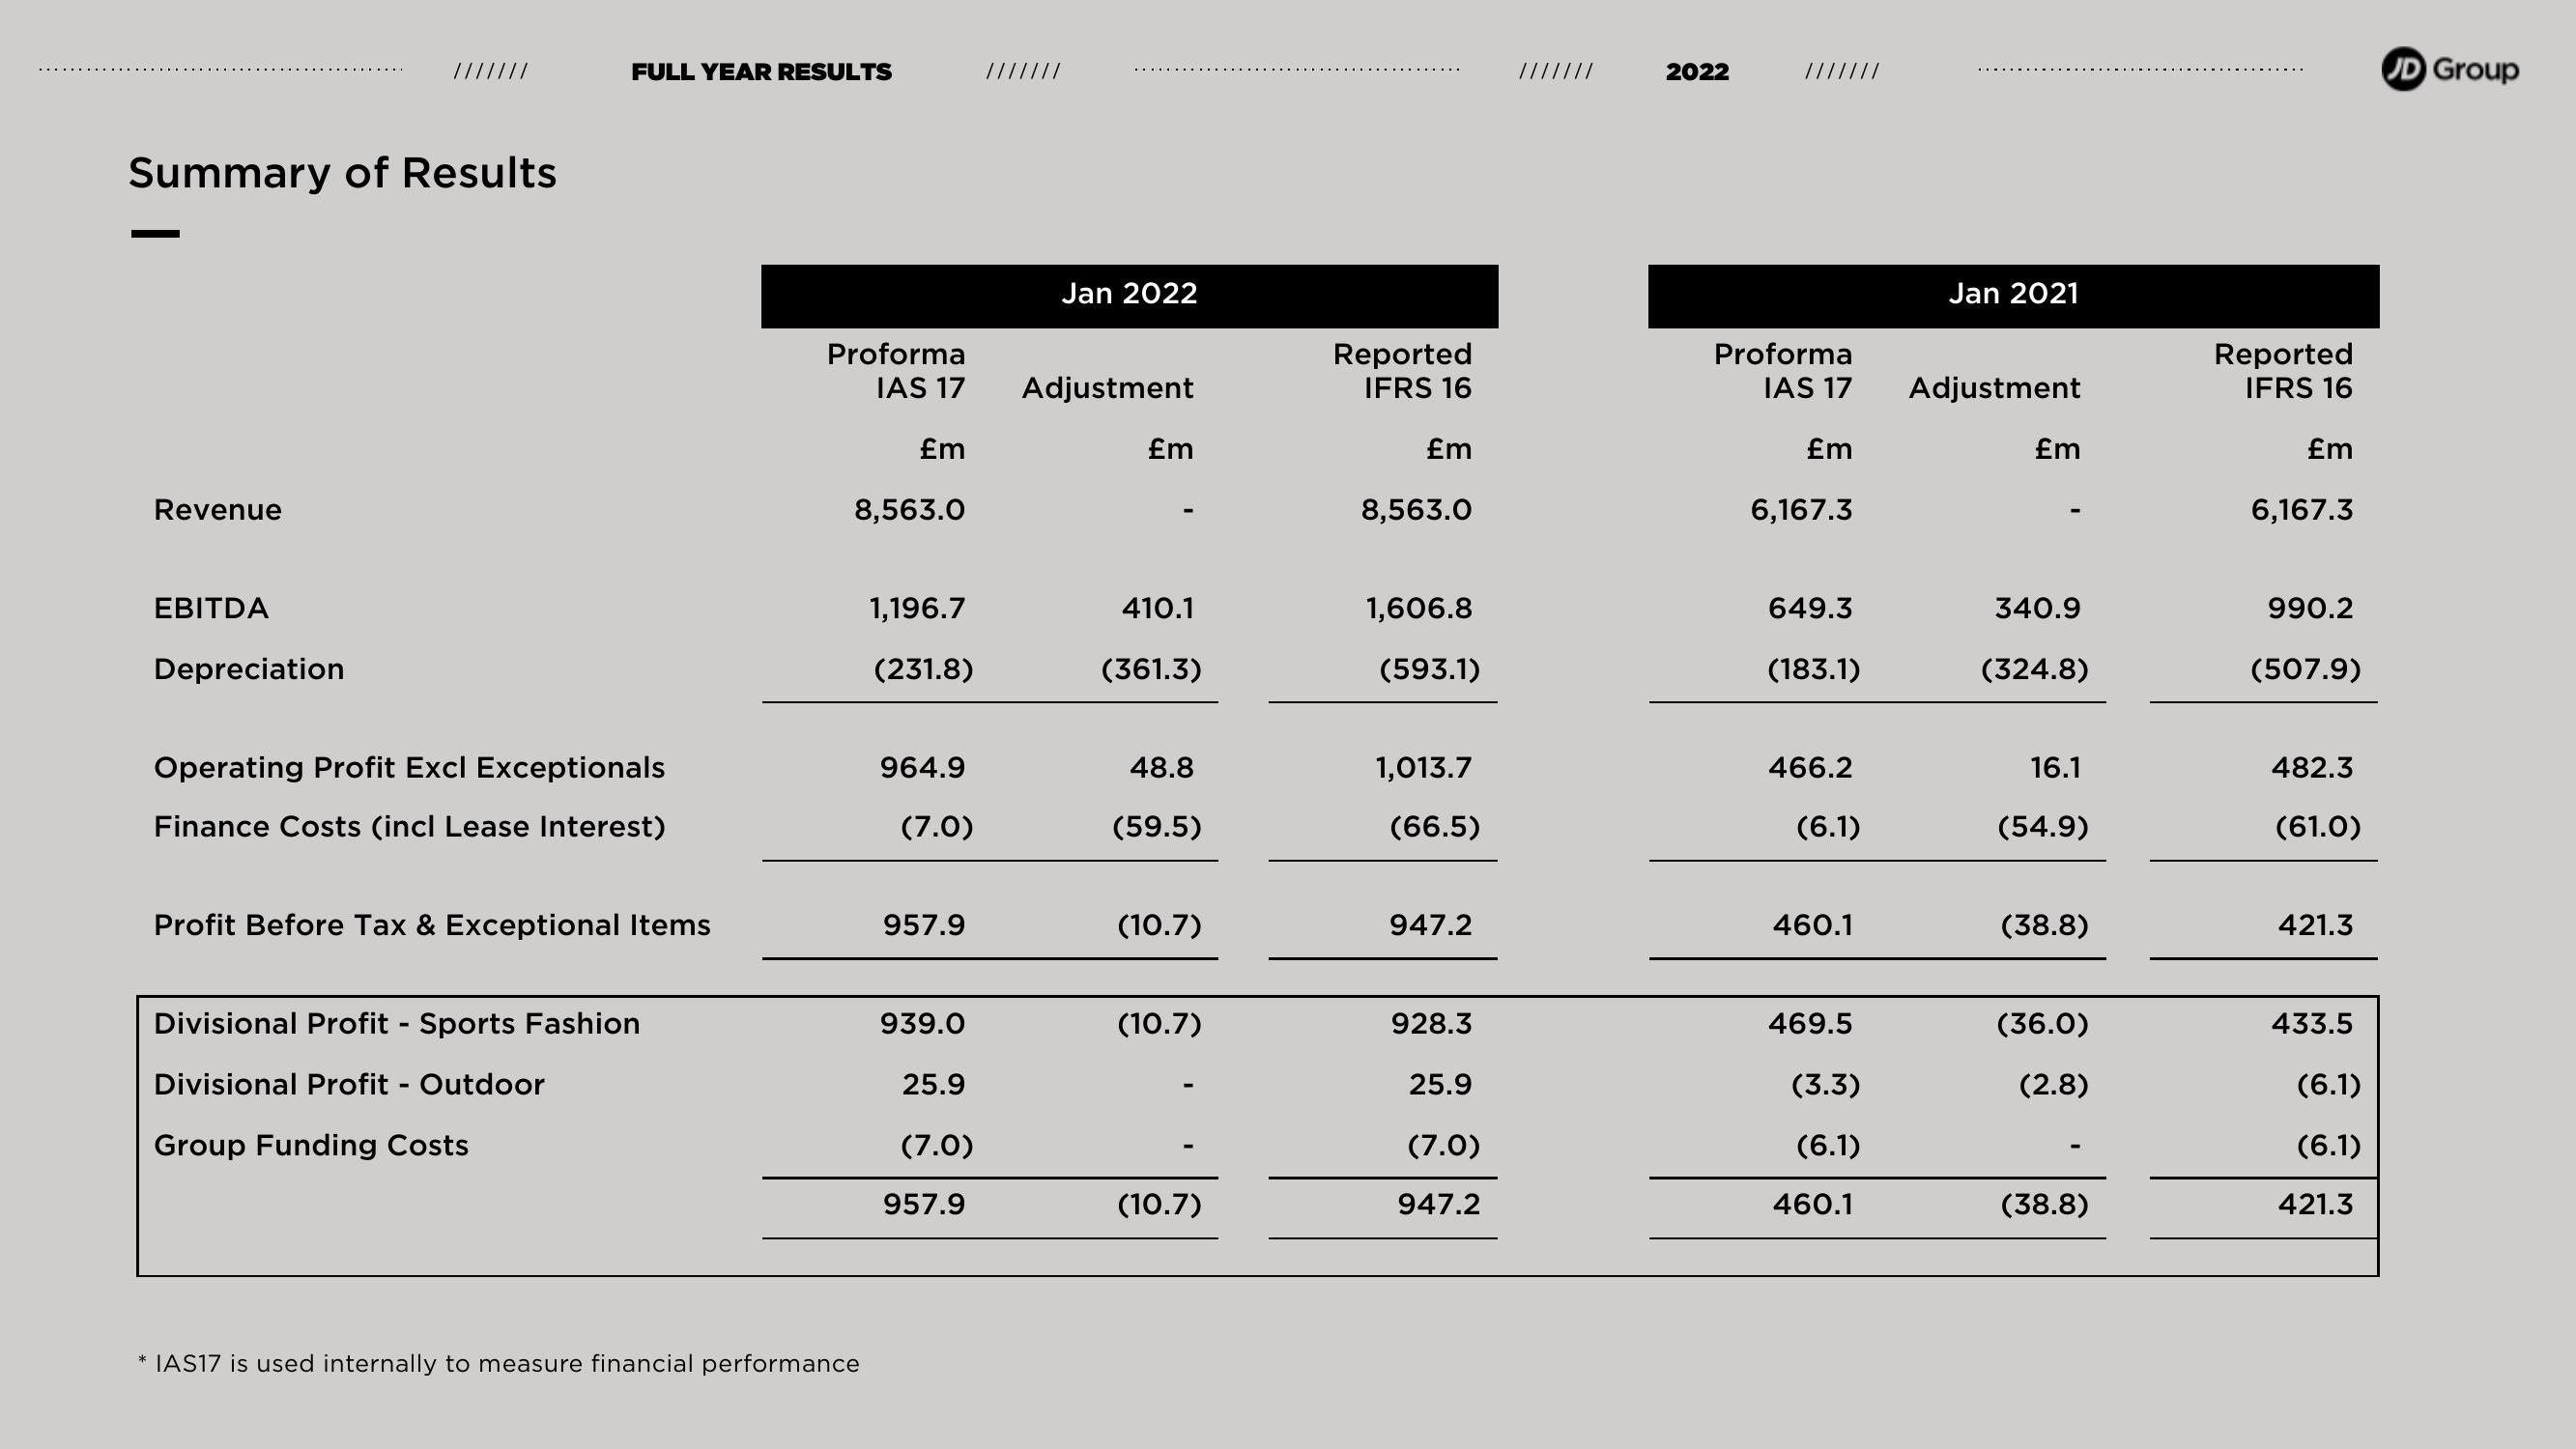
Summary of Results
Revenue
EBITDA
Depreciation
FULL YEAR RESULTS
Operating Profit Excl Exceptionals
Finance Costs (incl Lease Interest)
Profit Before Tax & Exceptional Items
Divisional Profit - Sports Fashion
Divisional Profit - Outdoor
Group Funding Costs
Proforma
IAS 17
£m
8,563.0
* IAS17 is used internally to measure financial performance
1,196.7
(231.8)
964.9
(7.0)
957.9
939.0
25.9
(7.0)
957.9
Jan 2022
Adjustment
£m
410.1
(361.3)
48.8
(59.5)
(10.7)
(10.7)
(10.7)
Reported
IFRS 16
£m
8,563.0
1,606.8
(593.1)
1,013.7
(66.5)
947.2
928.3
25.9
(7.0)
947.2
2022
///////
Proforma
IAS 17
£m
6,167.3
649.3
(183.1)
466.2
(6.1)
460.1
469.5
(3.3)
(6.1)
460.1
Jan 2021
Adjustment
£m
340.9
(324.8)
16.1
(54.9)
(38.8)
(36.0)
(2.8)
(38.8)
Reported
IFRS 16
£m
6,167.3
990.2
(507.9)
482.3
(61.0)
421.3
433.5
(6.1)
(6.1)
421.3
JD GroupView entire presentation