Ashtead Group Results Presentation Deck
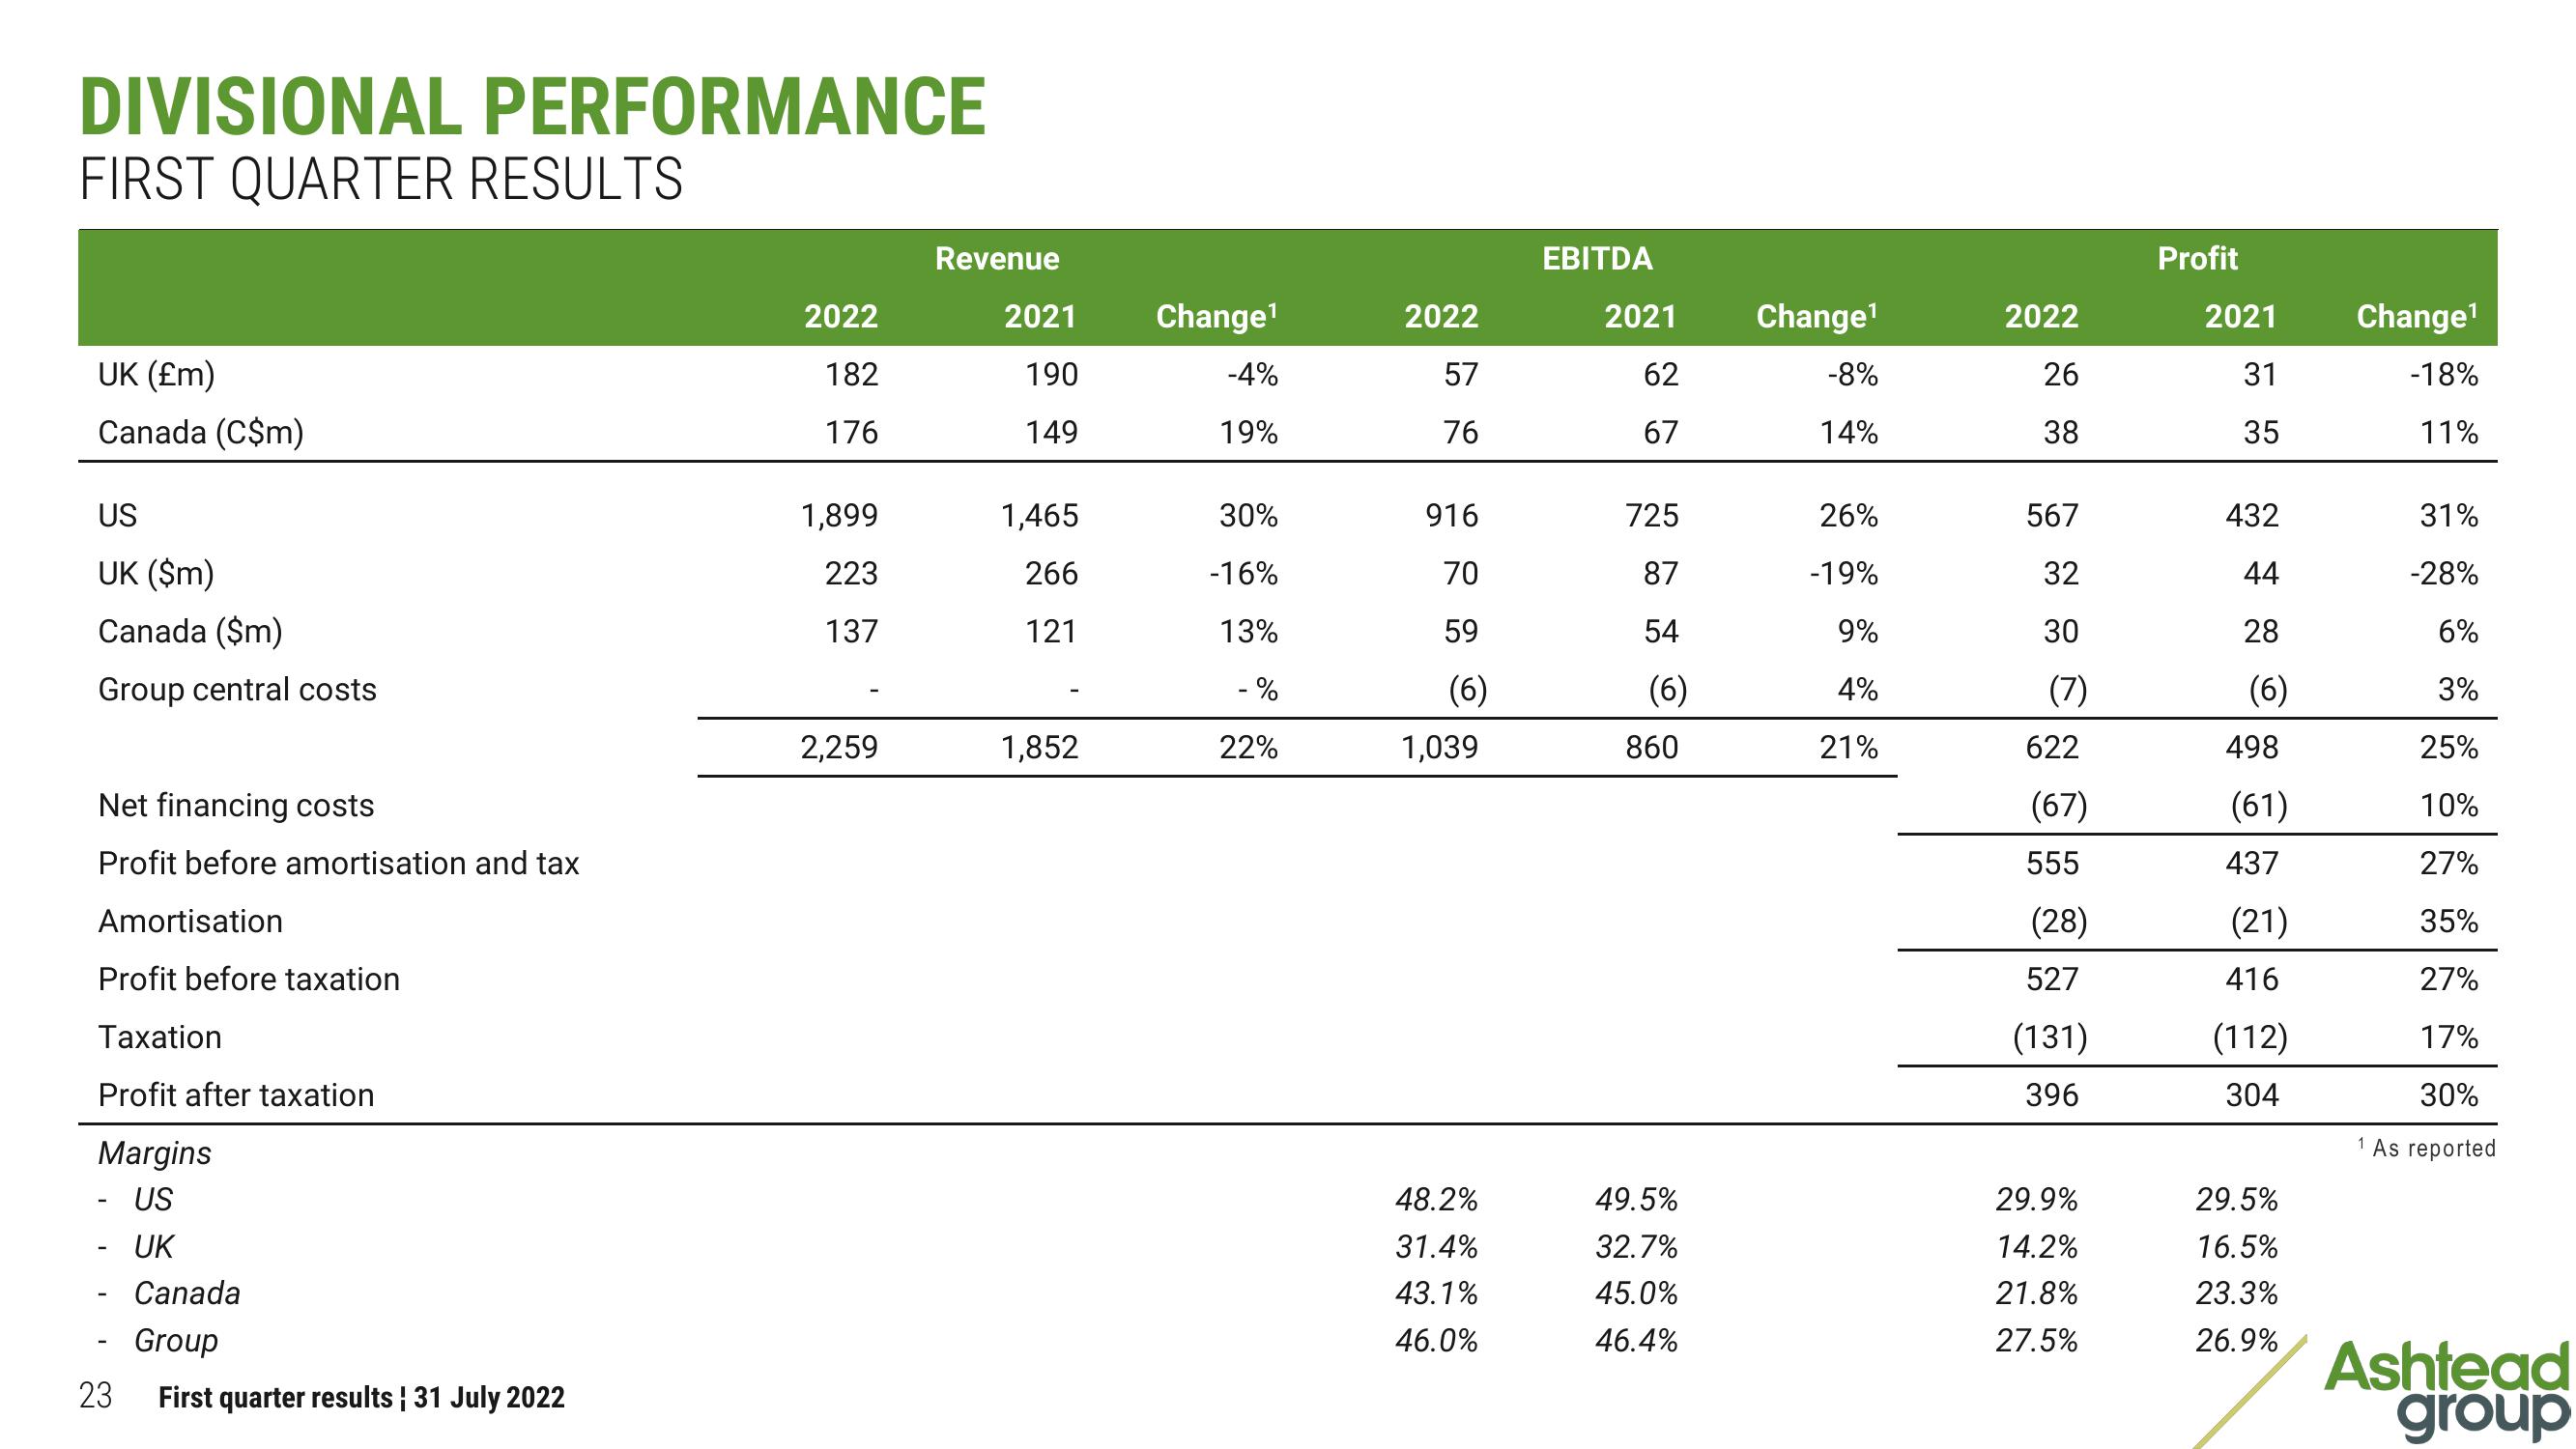
DIVISIONAL PERFORMANCE
FIRST QUARTER RESULTS
UK (£m)
Canada (C$m)
US
UK ($m)
Canada ($m)
Group central costs
Net financing costs
Profit before amortisation and tax
Amortisation
Profit before taxation
Taxation
Profit after taxation
Margins
US
- UK
23
Canada
Group
First quarter results ¦ 31 July 2022
2022
182
176
1,899
223
137
2,259
Revenue
2021
190
149
1,465
266
121
1,852
Change¹
-4%
19%
30%
-16%
13%
- %
22%
2022
57
76
916
70
59
(6)
1,039
48.2%
31.4%
43.1%
46.0%
EBITDA
2021
62
67
725
87
54
(6)
860
49.5%
32.7%
45.0%
46.4%
Change¹
-8%
14%
26%
-19%
9%
4%
21%
2022
26
38
567
32
30
(7)
622
(67)
555
(28)
527
(131)
396
29.9%
14.2%
21.8%
27.5%
Profit
2021
31
35
432
44
28
(6)
498
(61)
437
(21)
416
(112)
304
29.5%
16.5%
23.3%
26.9%
Change¹
-18%
11%
31%
-28%
6%
3%
25%
10%
27%
35%
27%
17%
30%
1 As reported
Ashtead
groupView entire presentation