AgroFresh SPAC Presentation Deck
AgroFresh Q1 2015 Financial
US GAAP Net Sales
Unaudited ($ in millions)
$30
Q1 2014A
$5
$33
US GAAP
Income Before Income Taxes
Unaudited ($ in millions)
Q1 2014A
Q1 2015A
$10
Financial Results
Q1 2015A
Pro Forma Net Sales(1)(2)
Unaudited ($ in millions)
+15%
$28
% Margin
Q1 2014A
Pro Forma EBITDA(1)(2)
Unaudited ($ in millions)
$12
43%
Q1 2014A
+39%
$32
Q1 2015A
$17
52%
Q1 2015A
Commentary
●
●
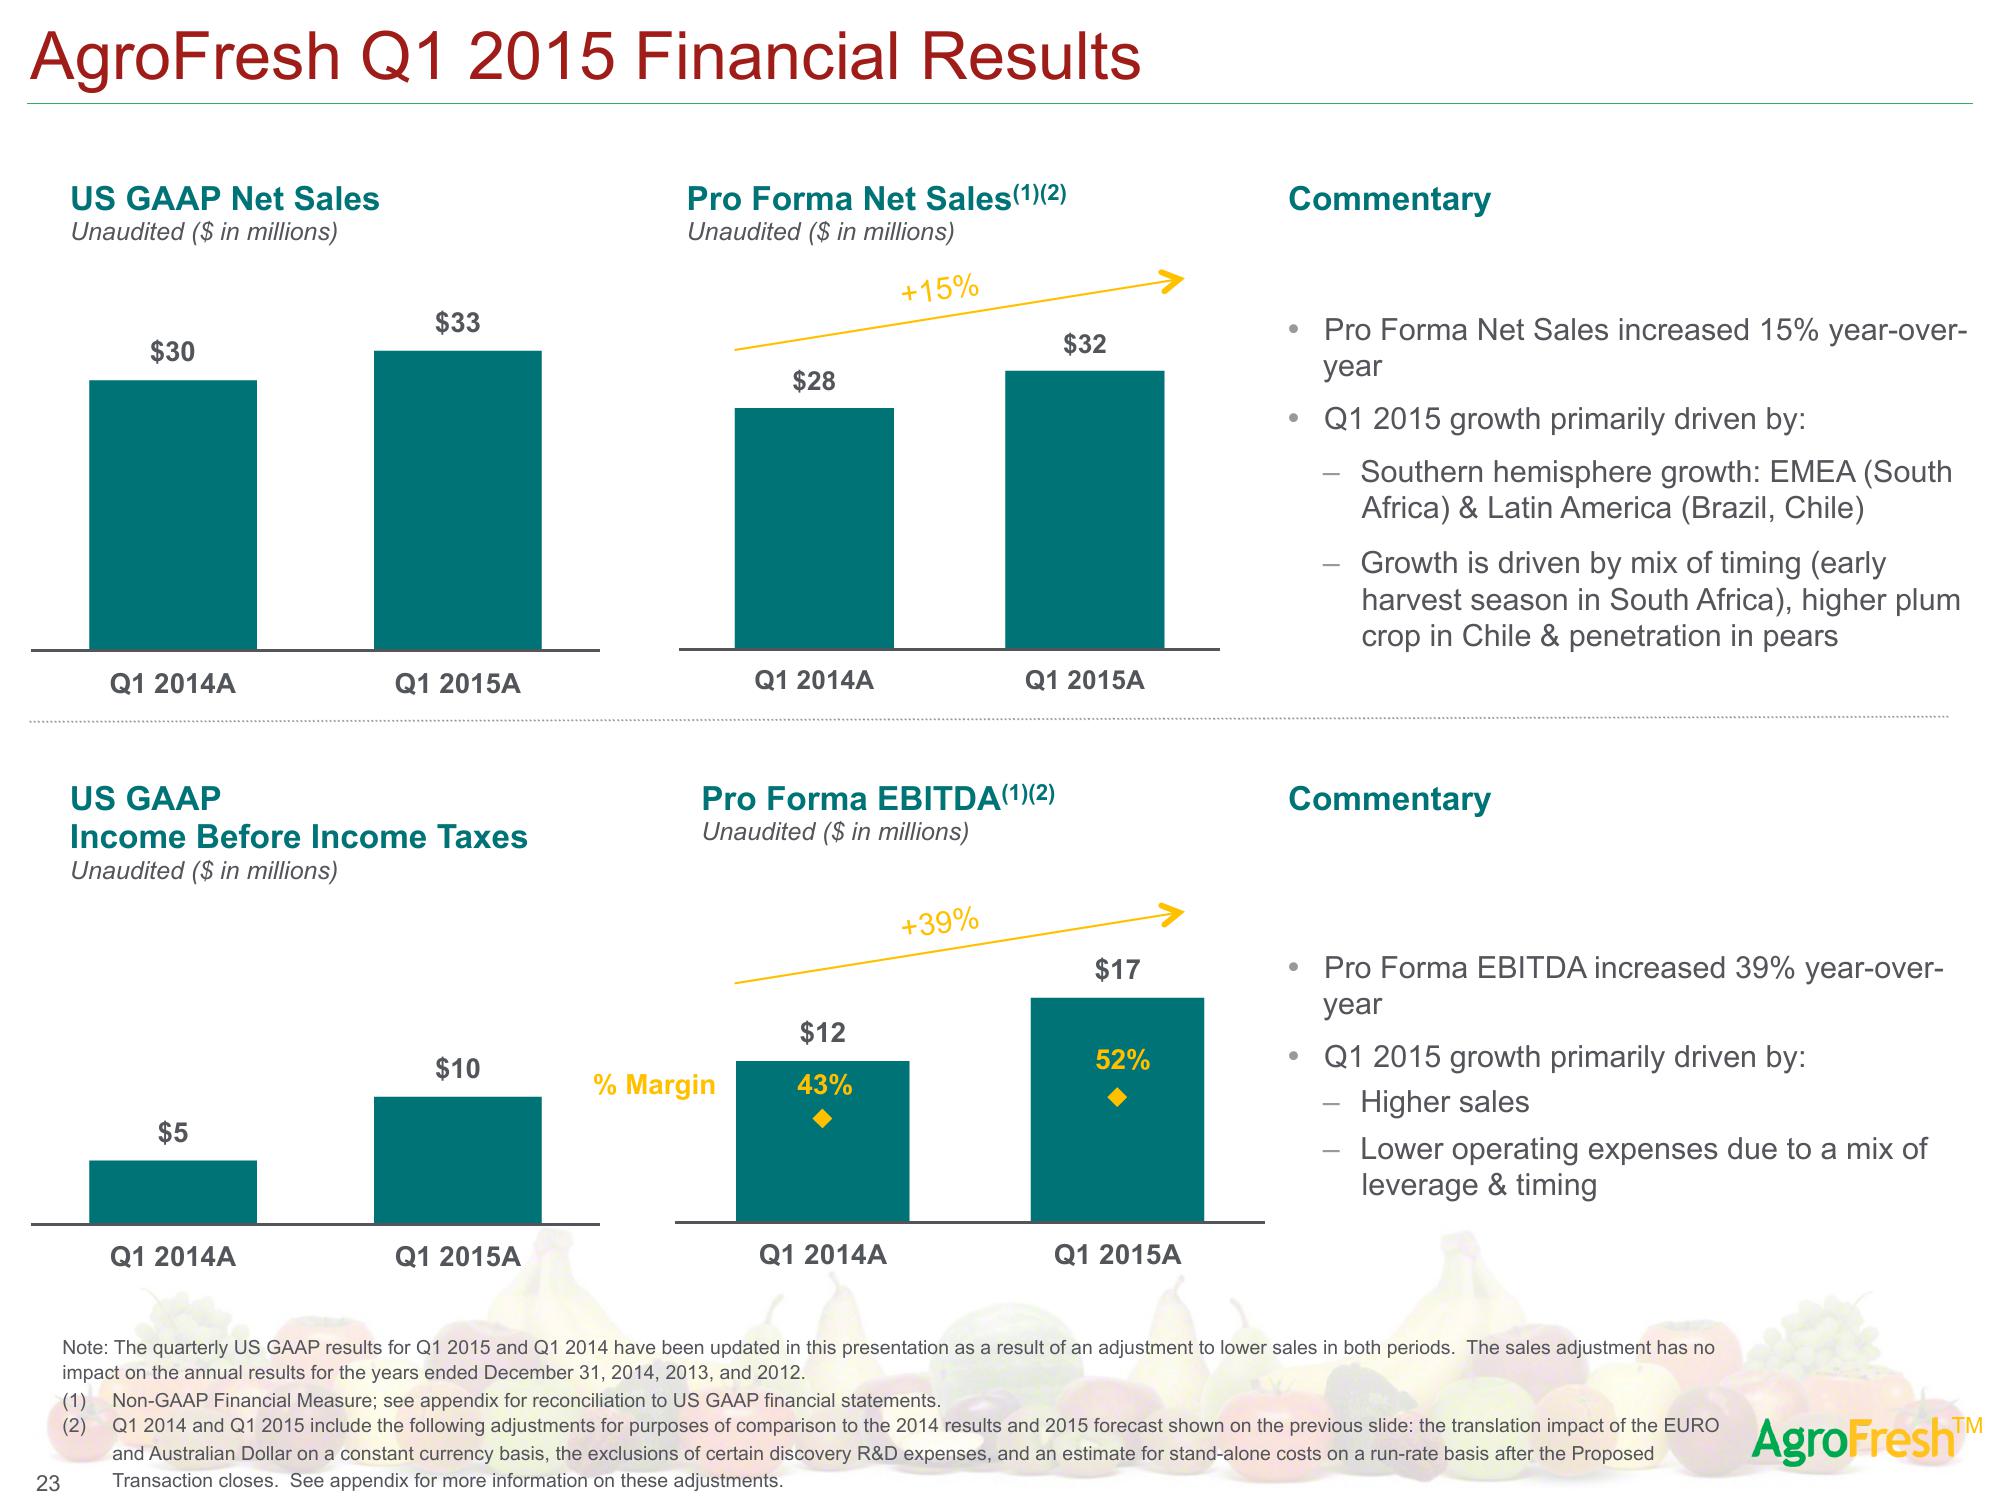
Pro Forma Net Sales increased 15% year-over-
year
●
Q1 2015 growth primarily driven by:
Southern hemisphere growth: EMEA (South
Africa) & Latin America (Brazil, Chile)
Commentary
Growth is driven by mix of timing (early
harvest season in South Africa), higher plum
crop in Chile & penetration in pears
Pro Forma EBITDA increased 39% year-over-
year
Q1 2015 growth primarily driven by:
Higher sales
Lower operating expenses due to a mix of
leverage & timing
Note: The quarterly US GAAP results for Q1 2015 and Q1 2014 have been updated in this presentation as a result of an adjustment to lower sales in both periods. The sales adjustment has no
impact on the annual results for the years ended December 31, 2014, 2013, and 2012.
(1) Non-GAAP Financial Measure; see appendix for reconciliation to US GAAP financial statements.
(2)
Q1 2014 and Q1 2015 include the following adjustments for purposes of comparison to the 2014 results and 2015 forecast shown on the previous slide: the translation impact of the EURO
and Australian Dollar on a constant currency basis, the exclusions of certain discovery R&D expenses, and an estimate for stand-alone costs on a run-rate basis after the Proposed
23 Transaction closes. See appendix for more information on these adjustments.
AgroFresh™View entire presentation