Tradeweb Results Presentation Deck
13
Capital Management & FY Guidance
■
■
■
$959.7 million in cash and cash equivalents (June 30th)
Undrawn $500 million credit facility
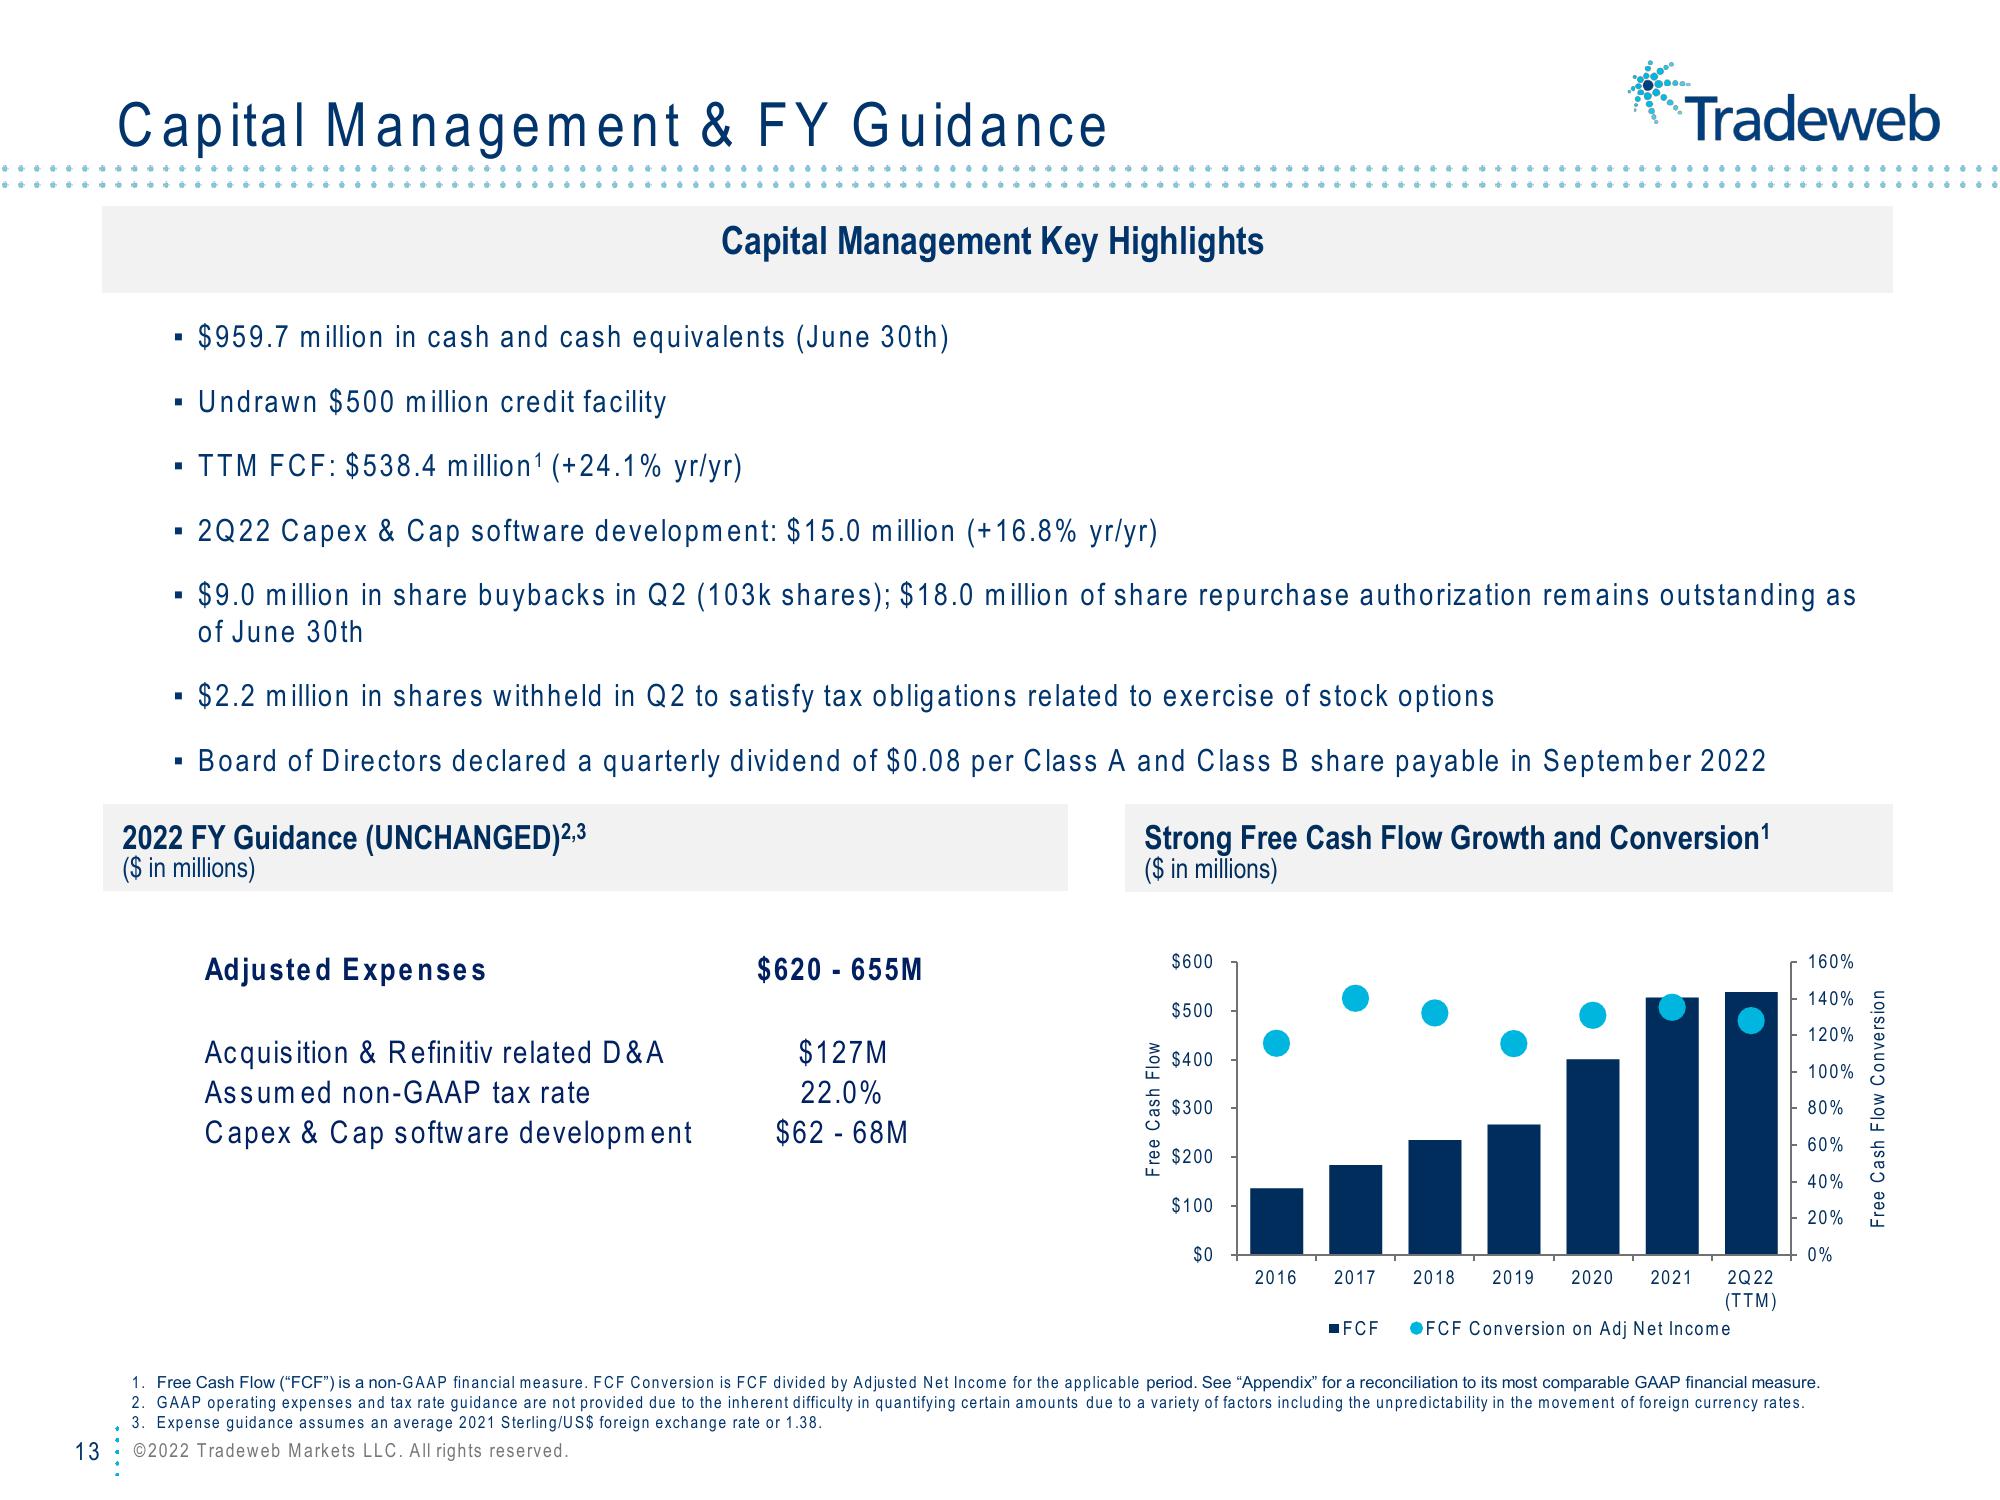
TTM FCF: $538.4 million¹ (+24.1% yr/yr)
Capital Management Key Highlights
▪ 2Q22 Capex & Cap software development: $15.0 million (+16.8% yr/yr)
$9.0 million in share buybacks in Q2 (103k shares); $18.0 million of share repurchase authorization remains outstanding as
of June 30th
2022 FY Guidance (UNCHANGED)2,3
($ in millions)
▪ $2.2 million in shares withheld in Q2 to satisfy tax obligations related to exercise of stock options
Board of Directors declared a quarterly dividend of $0.08 per Class A and Class B share payable in September 2022
Adjusted Expenses
Acquisition & Refinitiv related D&A
Assumed non-GAAP tax rate
Capex & Cap software development
$620 - 655M
$127M
22.0%
$62 - 68M
Strong Free Cash Flow Growth and Conversion¹
($ in millions)
Free Cash Flow
$600
$500
$400
$300
$200
$100
Tradeweb
$0
2016 2017
FCF
2018 2019 2020 2021 2Q22
(TTM)
FCF Conversion on Adj Net Income
160%
140%
120%
100%
- 80%
60%
40%
-20%
0%
1. Free Cash Flow ("FCF") is a non-GAAP financial measure. FCF Conversion is FCF divided by Adjusted Net Income for the applicable period. See "Appendix" for a reconciliation to its most comparable GAAP financial measure.
2. GAAP operating expenses and tax rate guidance are not provided due to the inherent difficulty in quantifying certain amounts due to a variety of factors including the unpredictability in the movement of foreign currency rates.
3. Expense guidance assumes an average 2021 Sterling/US$ foreign exchange rate or 1.38.
©2022 Tradeweb Markets LLC. All rights reserved.
Free Cash Flow ConversionView entire presentation