Silicon Valley Bank Results Presentation Deck
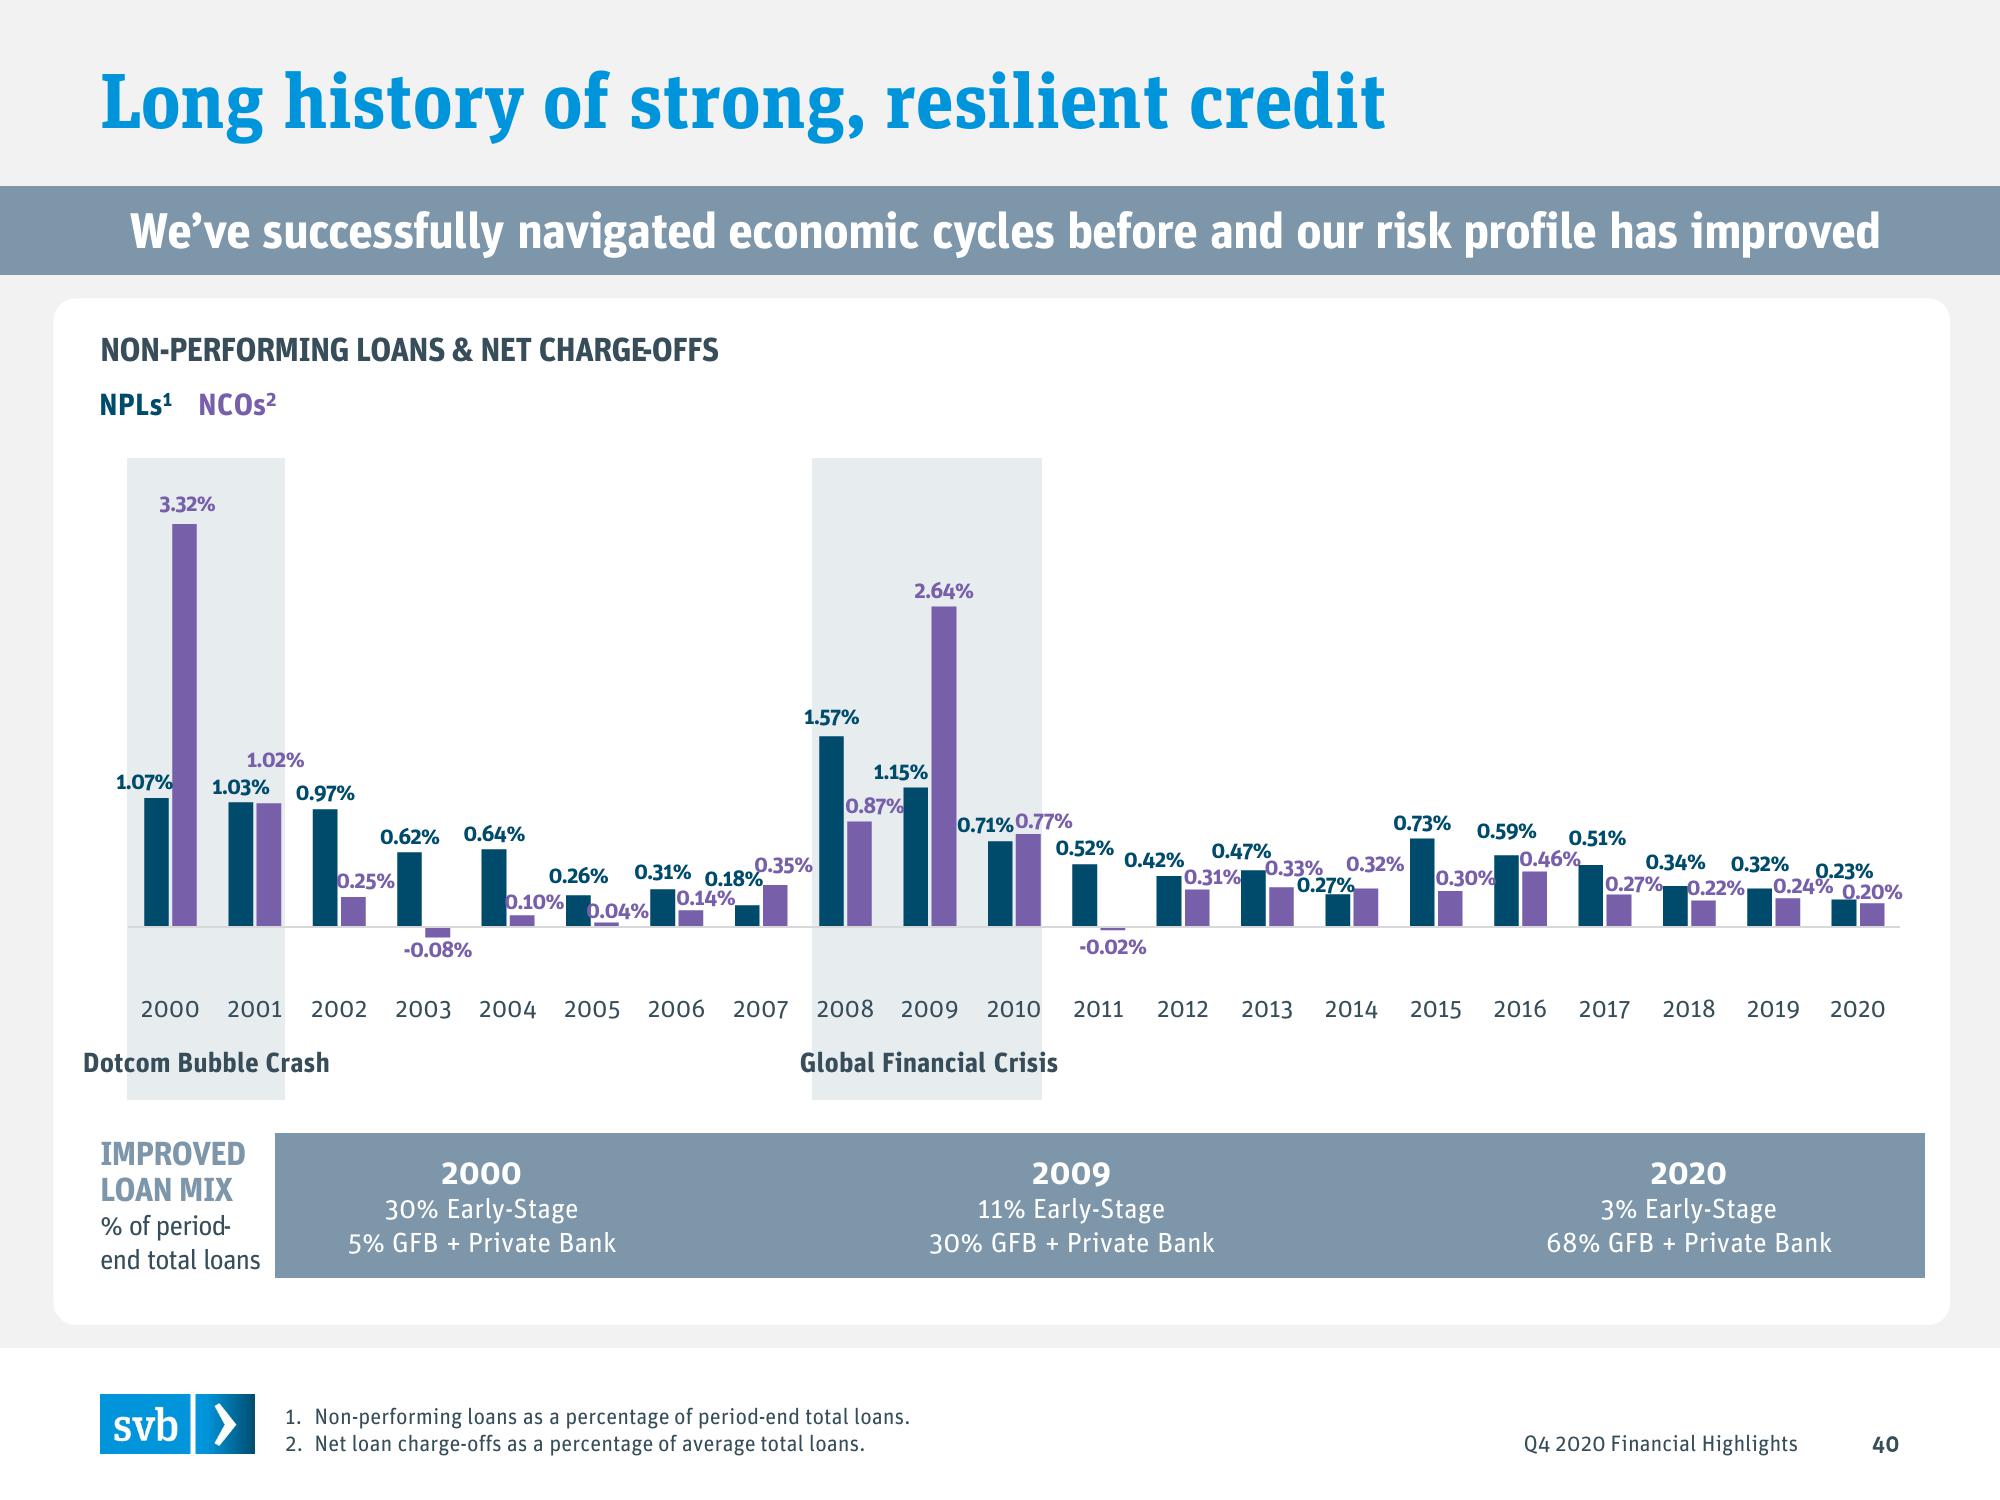
Long history of strong, resilient credit
We've successfully navigated economic cycles before and our risk profile has improved
NON-PERFORMING LOANS & NET CHARGE-OFFS
NPLs¹ NCOs²
3.32%
1.07%
1.02%
1.03% 0.97%
Dotcom Bubble Crash
IMPROVED
LOAN MIX
% of period-
end total loans
svb >
0.62% 0.64%
[1
-0.08%
0.25%
0.26%
0.10%
0.04%
0.31% 0.18%
10.14%
2000
30% Early-Stage
5% GFB + Private Bank
1.57%
0.35%
1.15%
0.87%
2.64%
1. Non-performing loans as a percentage of period-end total loans.
2. Net loan charge-offs as a percentage of average total loans.
0.71% 0.77%
0.52%
0.42%
-0.02%
0.47%
0.31%
2009
11% Early-Stage
30% GFB + Private Bank
0.73% 0.59%
0.32%
0.33%
0.27%
0.30%
2000 2001 2002 2003 2004 2005 2006 2007 2008 2009 2010 2011 2012 2013 2014 2015 2016 2017 2018 2019 2020
Global Financial Crisis
0.51%
0.46%
0.34%
0.27% 0.22%
0.32%
0.23%
0.24% 0.20%
2020
3% Early-Stage
68% GFB + Private Bank
Q4 2020 Financial Highlights
40View entire presentation