UBS Results Presentation Deck
We are executing our strategy across the regions to drive growth and efficiency
FY22
Americas
PBT 2.0bn; C/1 86%
GWM NII +35% YoY
10bn in net private market
commitments in GWM
>20% of Barron's 2022 Top 100
PWM teams
21bn NNM in AM from SMA
4Q22
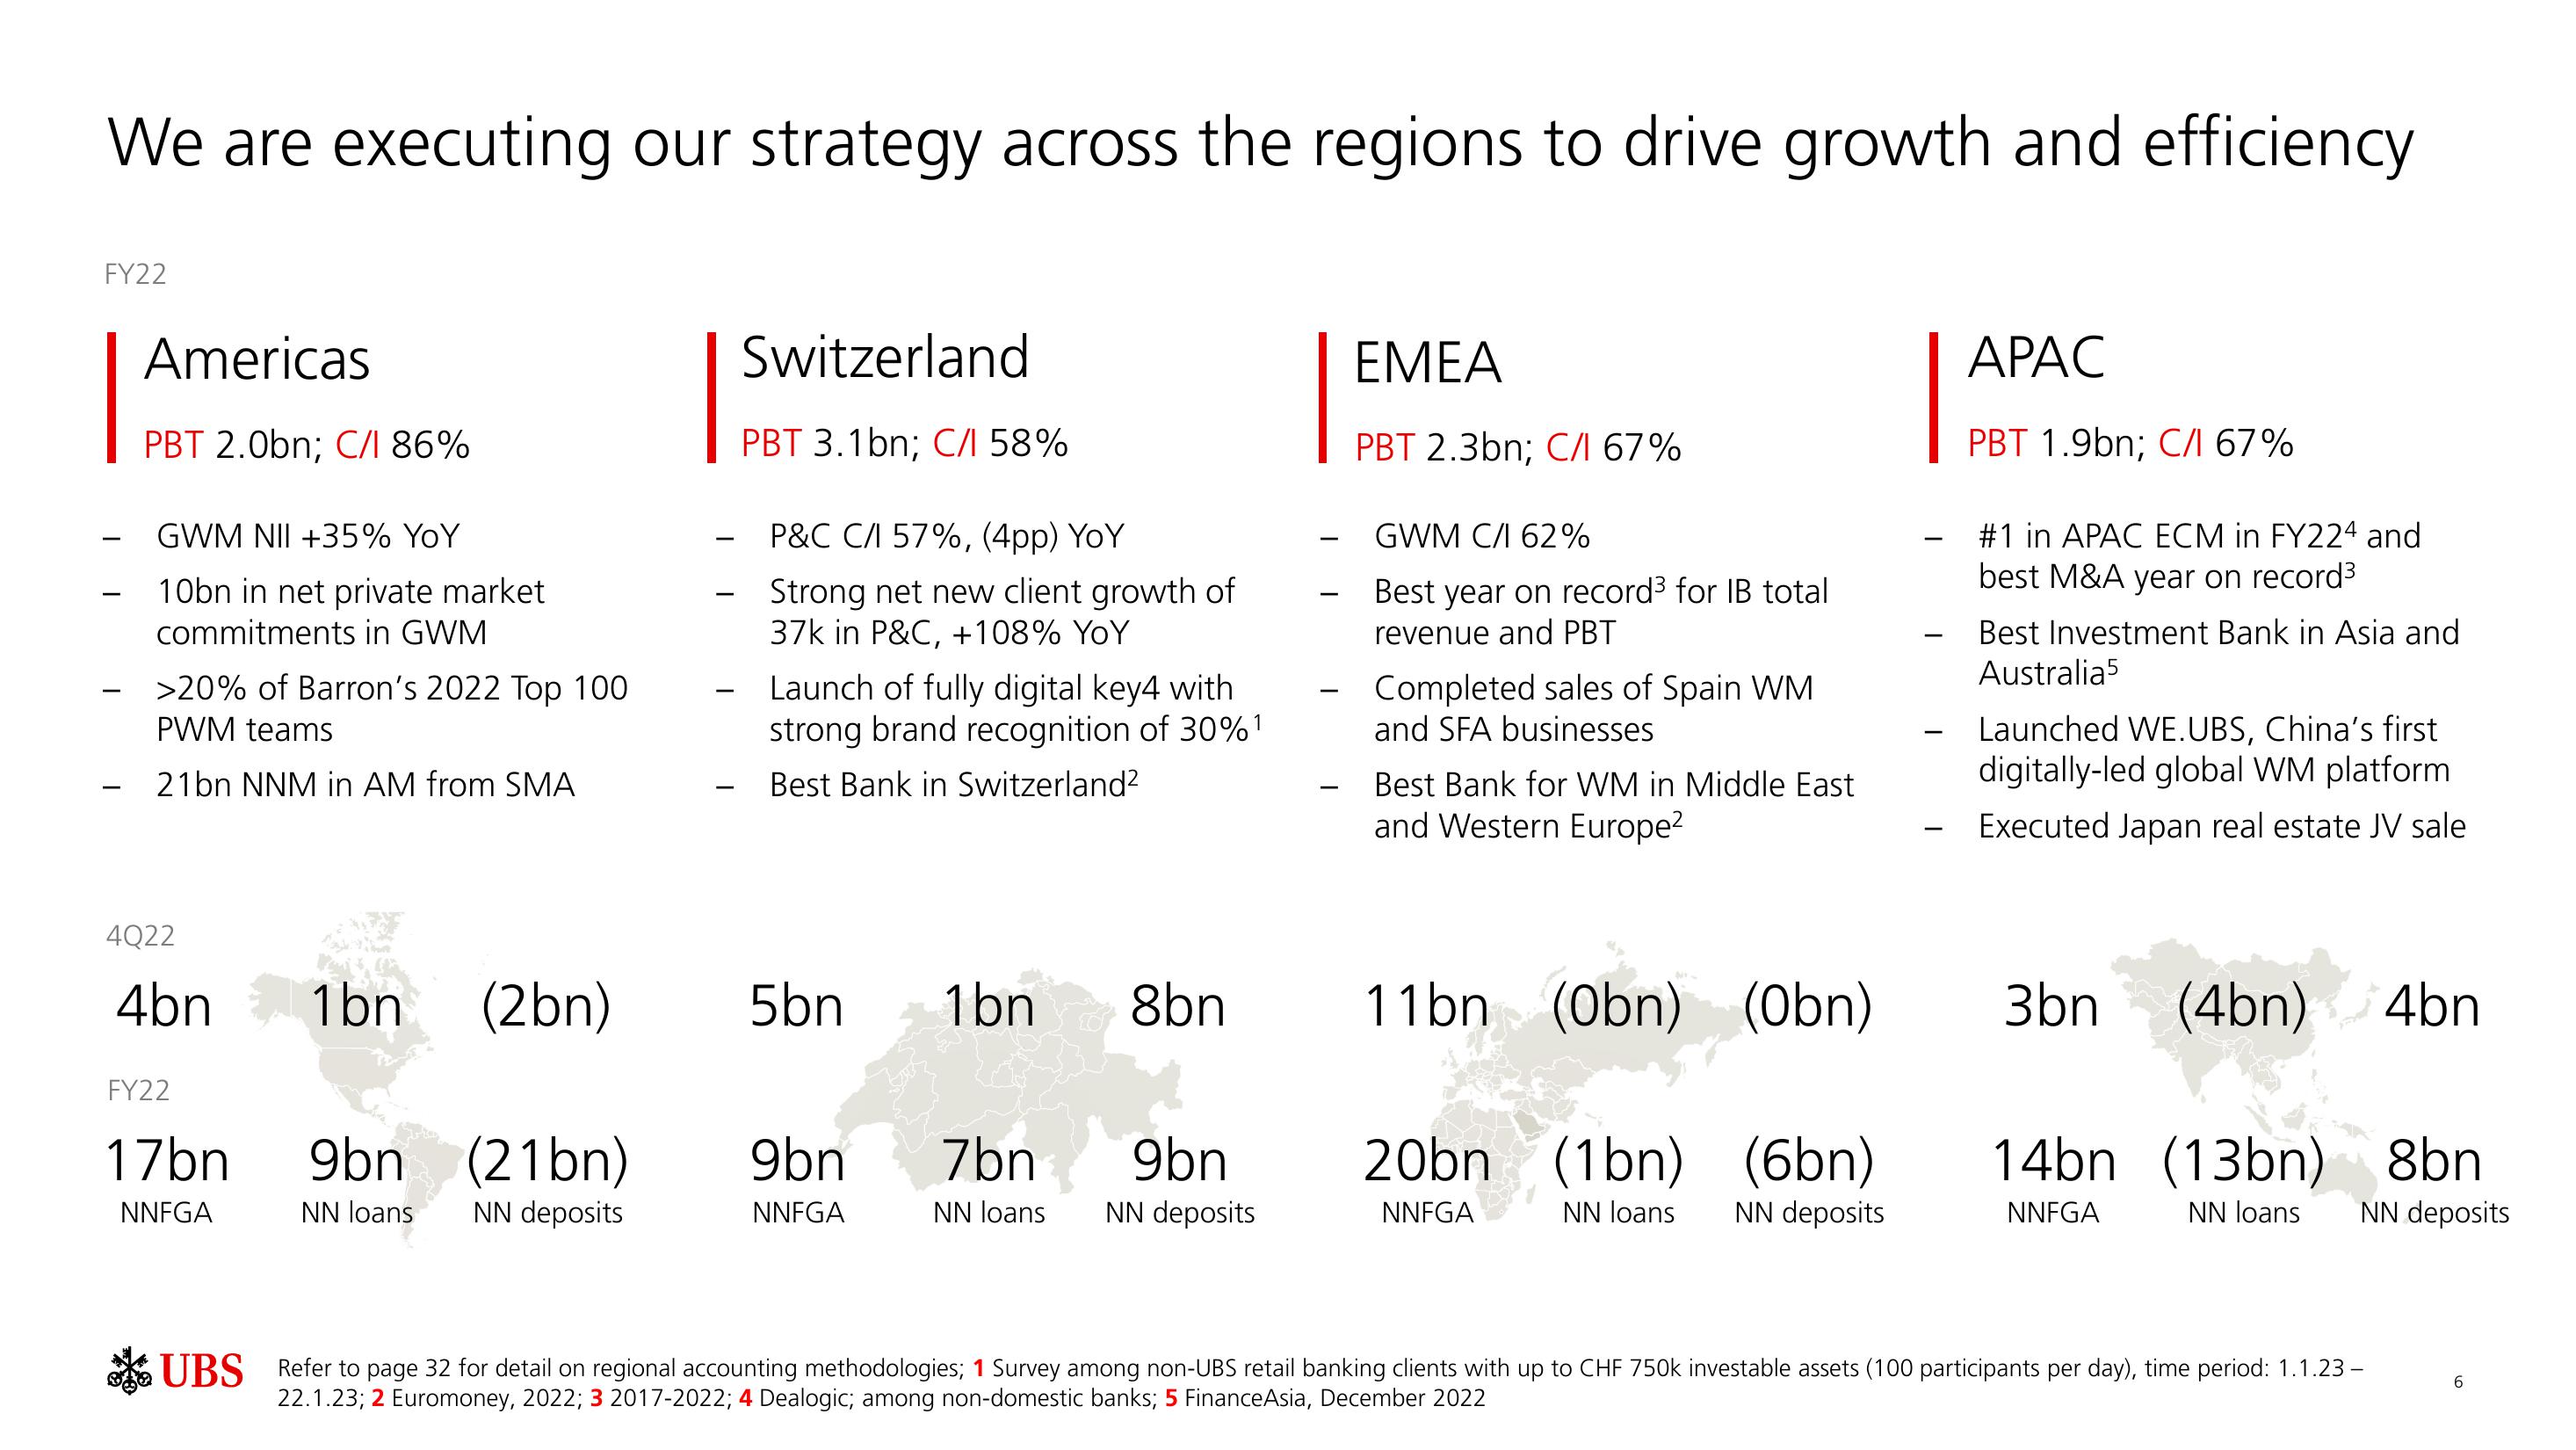
4bn
1bn
(2bn)
FY22
17bn 9bn (21bn)
NNFGA
NN loans
NN deposits
Switzerland
PBT 3.1bn; C/1 58%
P&C C/1 57%, (4pp) YOY
Strong net new client growth of
37k in P&C, +108% YoY
Launch of fully digital key4 with
strong brand recognition of 30%¹
Best Bank in Switzerland²
5bn 1bn 8bn
9bn
NNFGA
7bn 9bn
NN loans NN deposits
EMEA
PBT 2.3bn; C/I 67%
GWM C/I 62%
Best year on record³ for IB total
revenue and PBT
Completed sales of Spain WM
and SFA businesses
Best Bank for WM in Middle East
and Western Europe²
11bn (Obn)
20bn (1bn)
NNFGA
NN loans
(Obn)
(6bn)
NN deposits
-
-
APAC
PBT 1.9bn; C/1 67%
#1 in APAC ECM in FY224 and
best M&A year on record³
Best Investment Bank in Asia and
Australia5
Launched WE.UBS, China's first
digitally-led global WM platform
Executed Japan real estate JV sale
3bn (4bn) 4bn
14bn (13bn) 8bn
NNFGA
NN loans
NN deposits
UBS Refer to page 32 for detail on regional accounting methodologies; 1 Survey among non-UBS retail banking clients with up to CHF 750k investable assets (100 participants per day), time period: 1.1.23-
22.1.23; 2 Euromoney, 2022; 3 2017-2022; 4 Dealogic; among non-domestic banks; 5 FinanceAsia, December 2022
6View entire presentation