Active and Passive Investing
Be More Patient
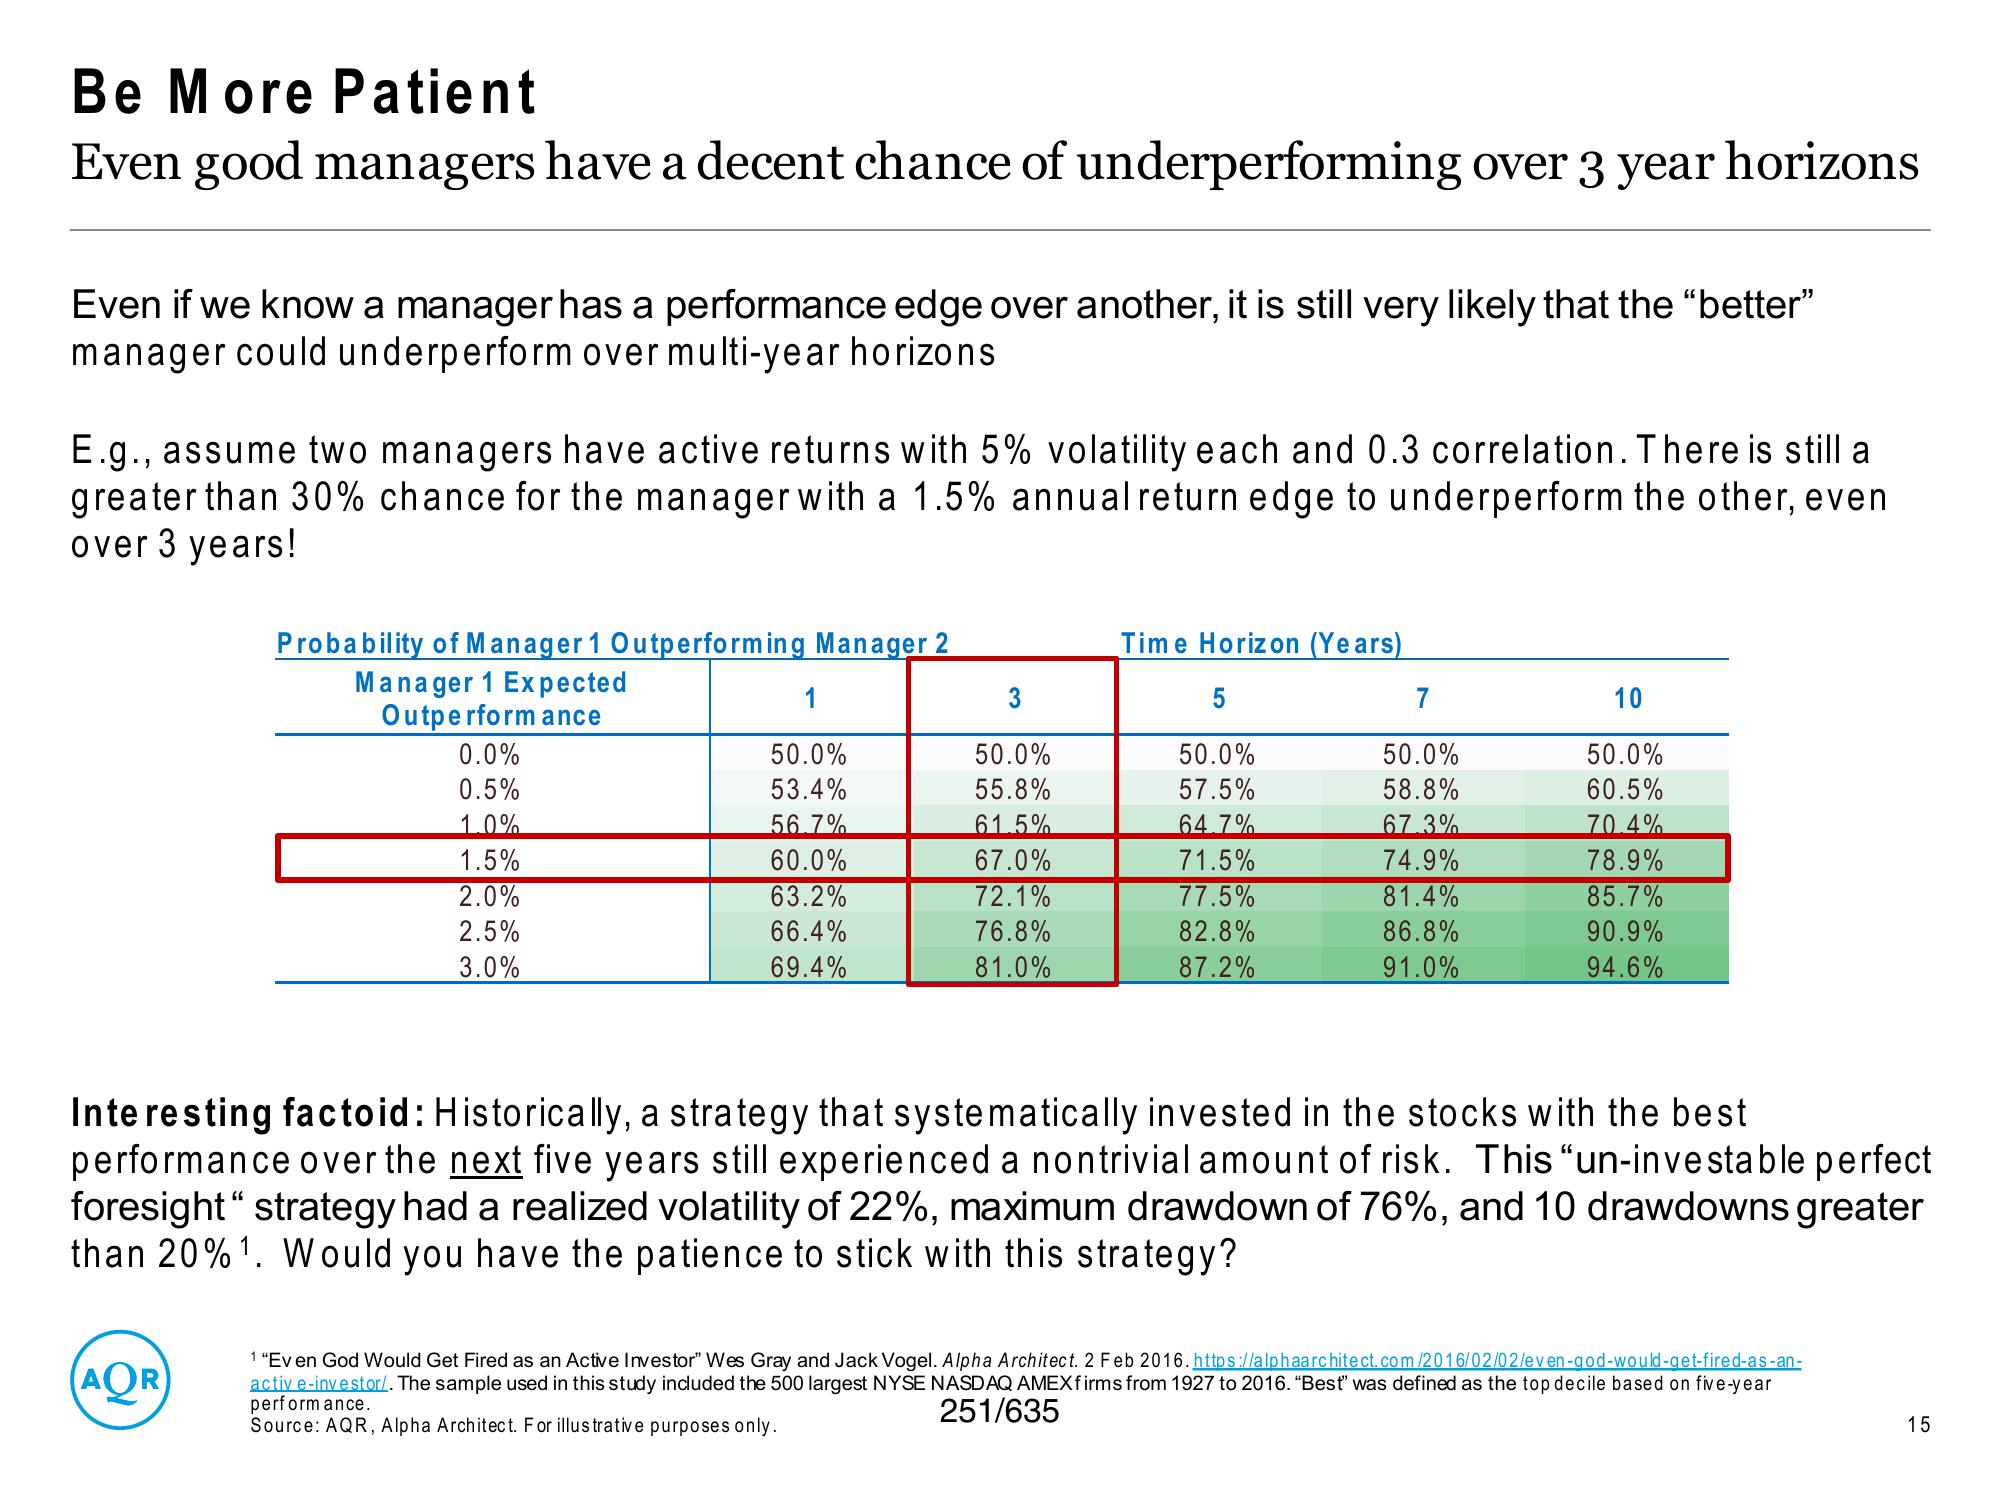
Even good managers have a decent chance of underperforming over 3 year horizons
Even if we know a manager has a performance edge over another, it is still very likely that the "better"
manager could underperform over multi-year horizons
E.g., assume two managers have active returns with 5% volatility each and 0.3 correlation. There is still a
greater than 30% chance for the manager with a 1.5% annual return edge to underperform the other, even
over 3 years!
Probability of Manager 1 Outperforming Manager 2
Manager 1 Expected
Outperformance
0.0%
0.5%
1.0%
(AOR
1.5%
2.0%
2.5%
3.0%
1
50.0%
53.4%
56.7%
60.0%
63.2%
66.4%
69.4%
3
50.0%
55.8%
61.5%
67.0%
72.1%
76.8%
81.0%
Time Horizon (Years)
5
50.0%
57.5%
64.7%
71.5%
77.5%
82.8%
87.2%
7
50.0%
58.8%
67.3%
74.9%
81.4%
86.8%
91.0%
10
50.0%
60.5%
70.4%
78.9%
85.7%
90.9%
94.6%
Interesting factoid: Historically, a strategy that systematically invested in the stocks with the best
performance over the next five years still experienced a nontrivial amount of risk. This "un-investable perfect
foresight" strategy had a realized volatility of 22%, maximum drawdown of 76%, and 10 drawdowns greater
than 20% ¹. Would you have the patience to stick with this strategy?
1 "Ev en God Would Get Fired as an Active Investor" Wes Gray and Jack Vogel. Alpha Architect. 2 Feb 2016. https://alphaarchitect.com/2016/02/02/even-god-would-get-fired-as-an-
activ e-investor/. The sample used in this study included the 500 largest NYSE NASDAQ AMEXfirms from 1927 to 2016. "Best" was defined as the top decile based on five-year
performance.
251/635
Source: AQR, Alpha Architect. For illustrative purposes only.
15View entire presentation