Silicon Valley Bank Results Presentation Deck
Client cash burn has not adjusted to slower fundraising environment, pressuring total client funds
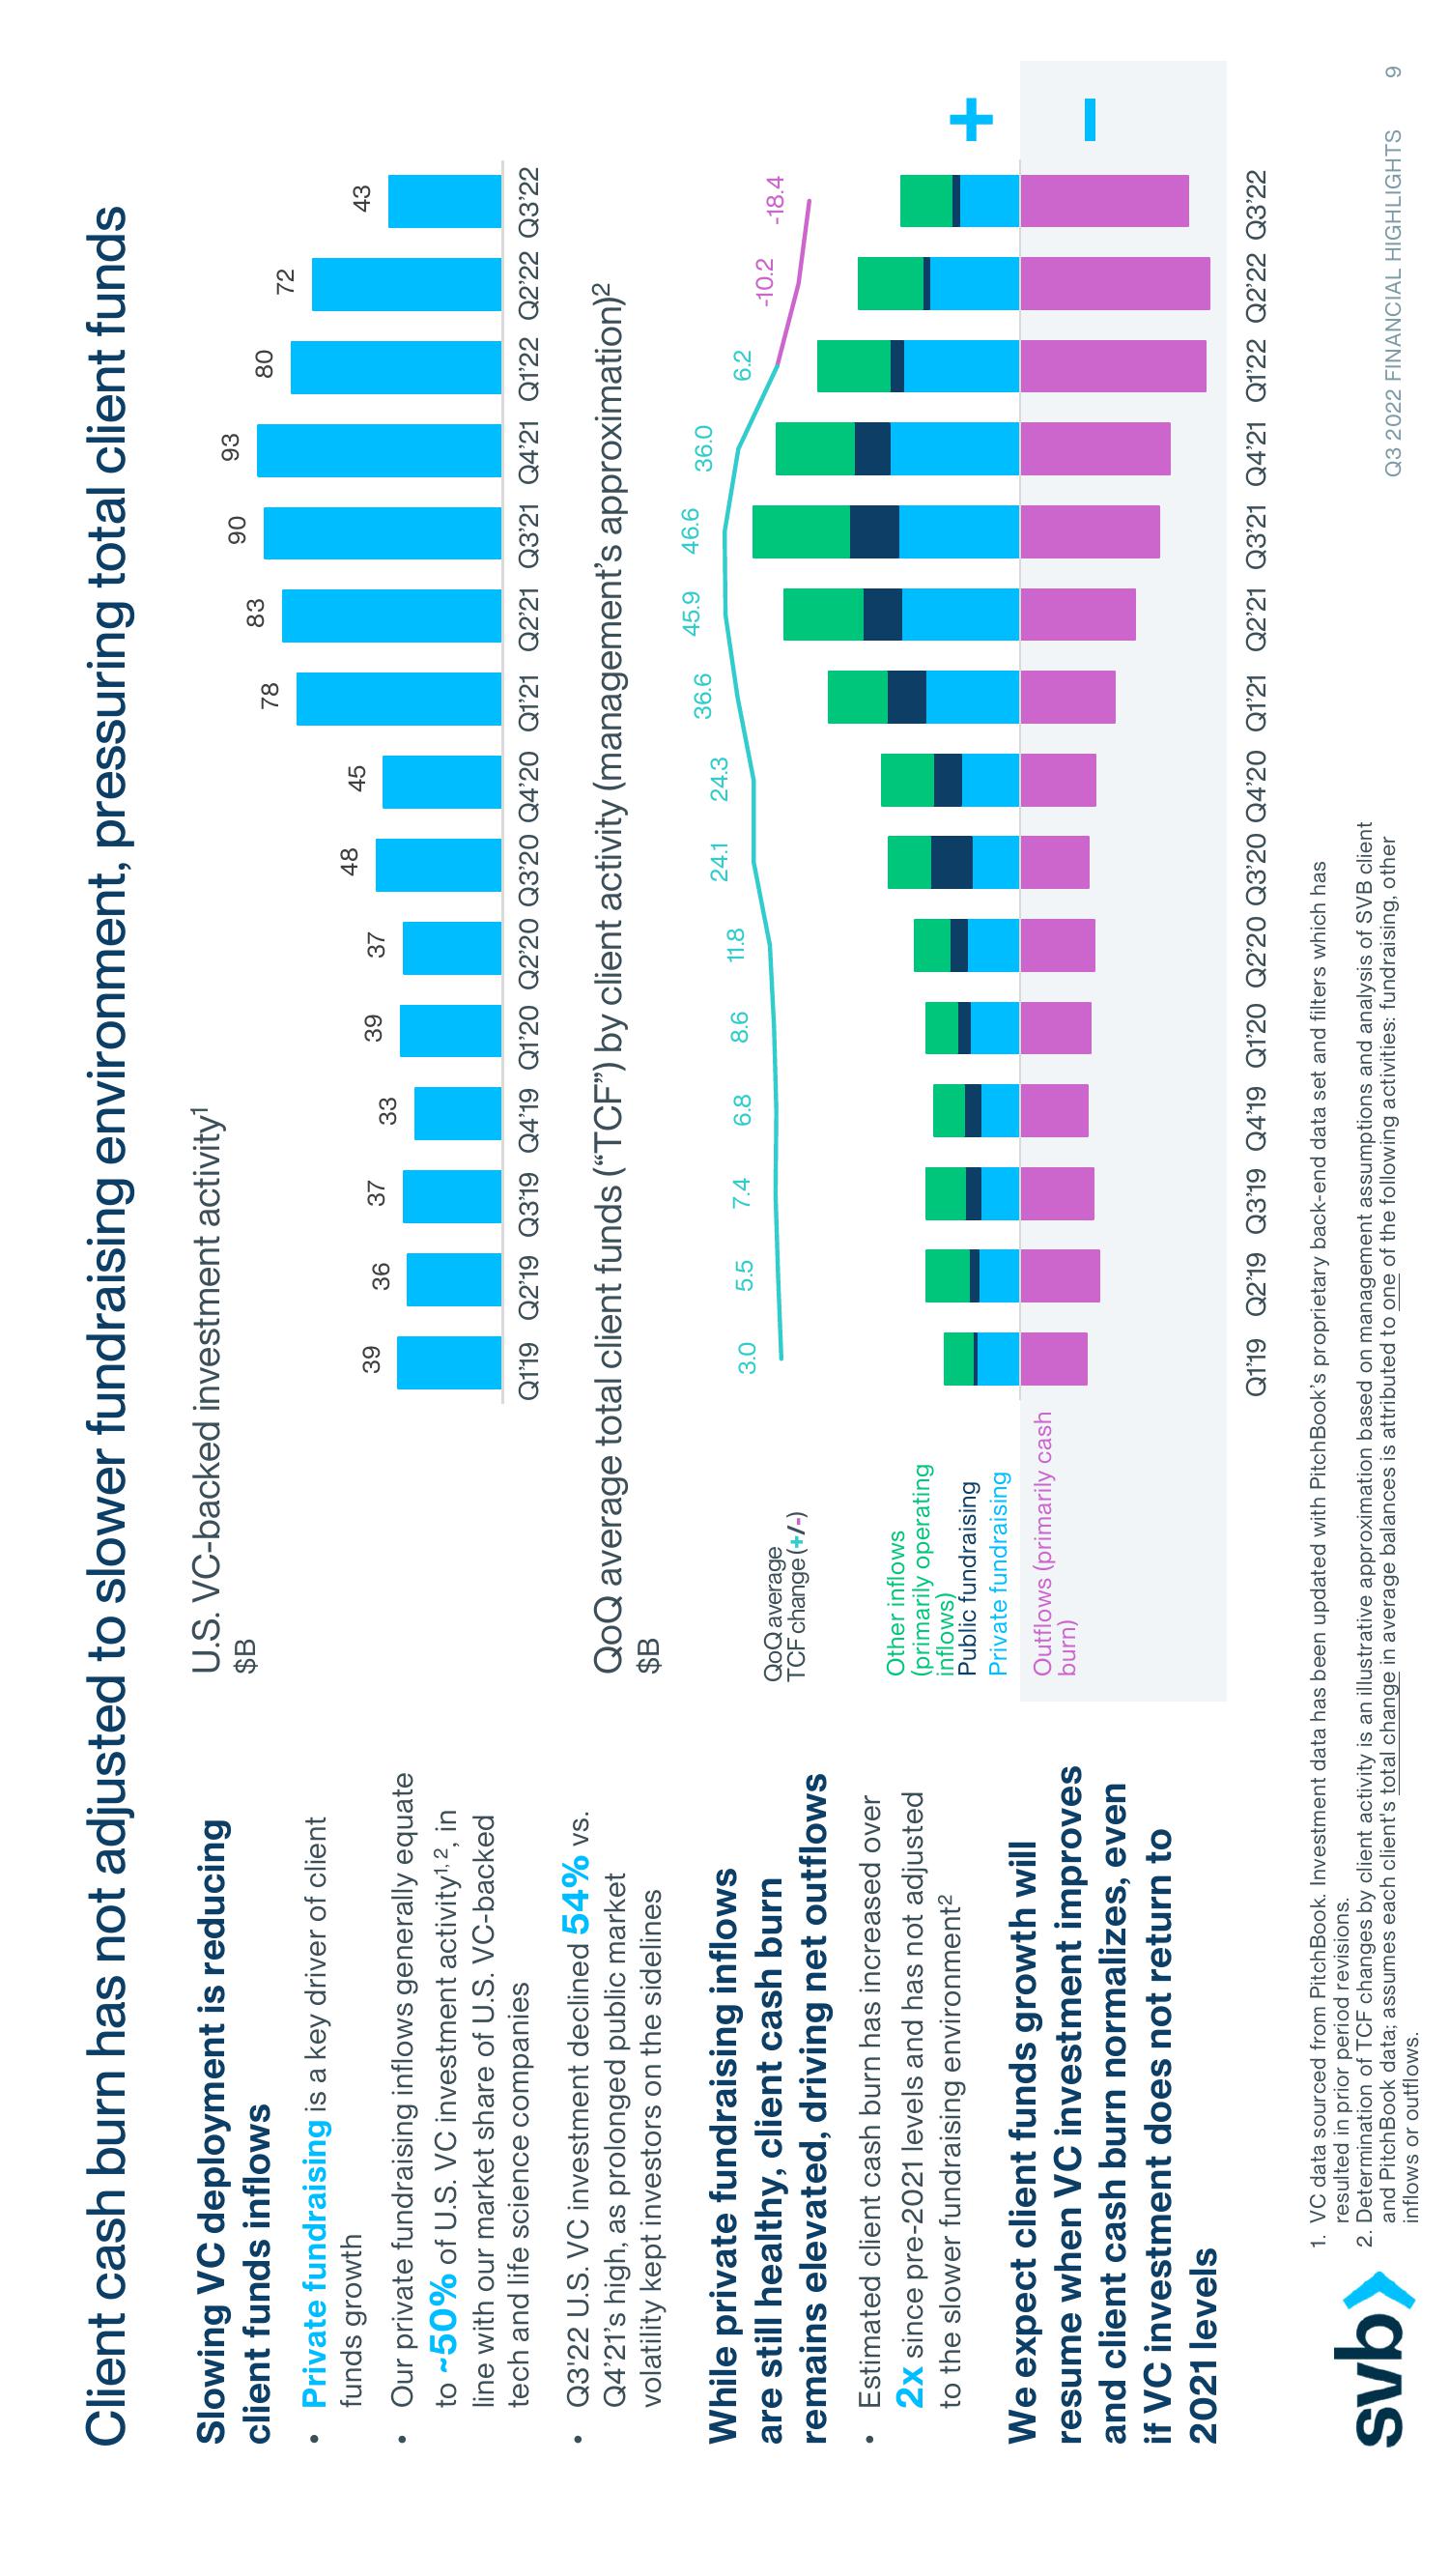
U.S. VC-backed investment activity¹
$B
Slowing VC deployment is reducing
client funds inflows
●
Private fundraising is a key driver of client
funds growth
●
Our private fundraising inflows generally equate
to ~50% of U.S. VC investment activity¹, 2, in
line with our market share of U.S. VC-backed
tech and life science companies
Q3'22 U.S. VC investment declined 54% vs.
Q4'21's high, as prolonged public market
volatility kept investors on the sidelines
While private fundraising inflows
are still healthy, client cash burn
remains elevated, driving net outflows
Estimated client cash burn has increased over
2x since pre-2021 levels and has not adjusted
to the slower fundraising environment²
We expect client funds growth will
resume when VC investment improves
and client cash burn normalizes, even
if VC investment does not return to
2021 levels
svb>
QoQ average
TCF change (+/-)
39
Other inflows
(primarily operating
inflows)
Public fundraising
Private fundraising
Outflows (primarily cash
burn)
36
3.0
37
5.5
33
7.4
39
6.8
37
8.6
48
QoQ average total client funds ("TCF") by client activity (management's approximation)²
$B
11.8
45
Q1'19 Q2'19 Q3'19 Q4'19 Q1'20 Q2'20 Q3'20 Q4'20 Q1'21 Q2'21 Q3'21 Q4'21 Q1'22 Q2'22 Q3'22
78
24.1 24.3
1. VC data sourced from Pitch Book. Investment data has been updated with PitchBook's proprietary back-end data set and filters which has
resulted in prior period revisions.
2. Determination of TCF changes by client activity is an illustrative approximation based on management assumptions and analysis of SVB client
and PitchBook data; assumes each client's total change in average balances is attributed to one of the following activities: fundraising, other
inflows or outflows.
83
90
36.6
93
45.9 46.6
80
36.0
72
6.2
43
-10.2
-18.4
Q1'19 Q2'19 Q3'19 Q4'19 Q1'20 Q2'20 Q3'20 Q4'20 Q1'21 Q2'21 Q3'21 Q4'21 Q1'22 Q2'22 Q3'22
+
Q3 2022 FINANCIAL HIGHLIGHTS 9View entire presentation