Blend Results Presentation Deck slide image

Blend Results Presentation Deck

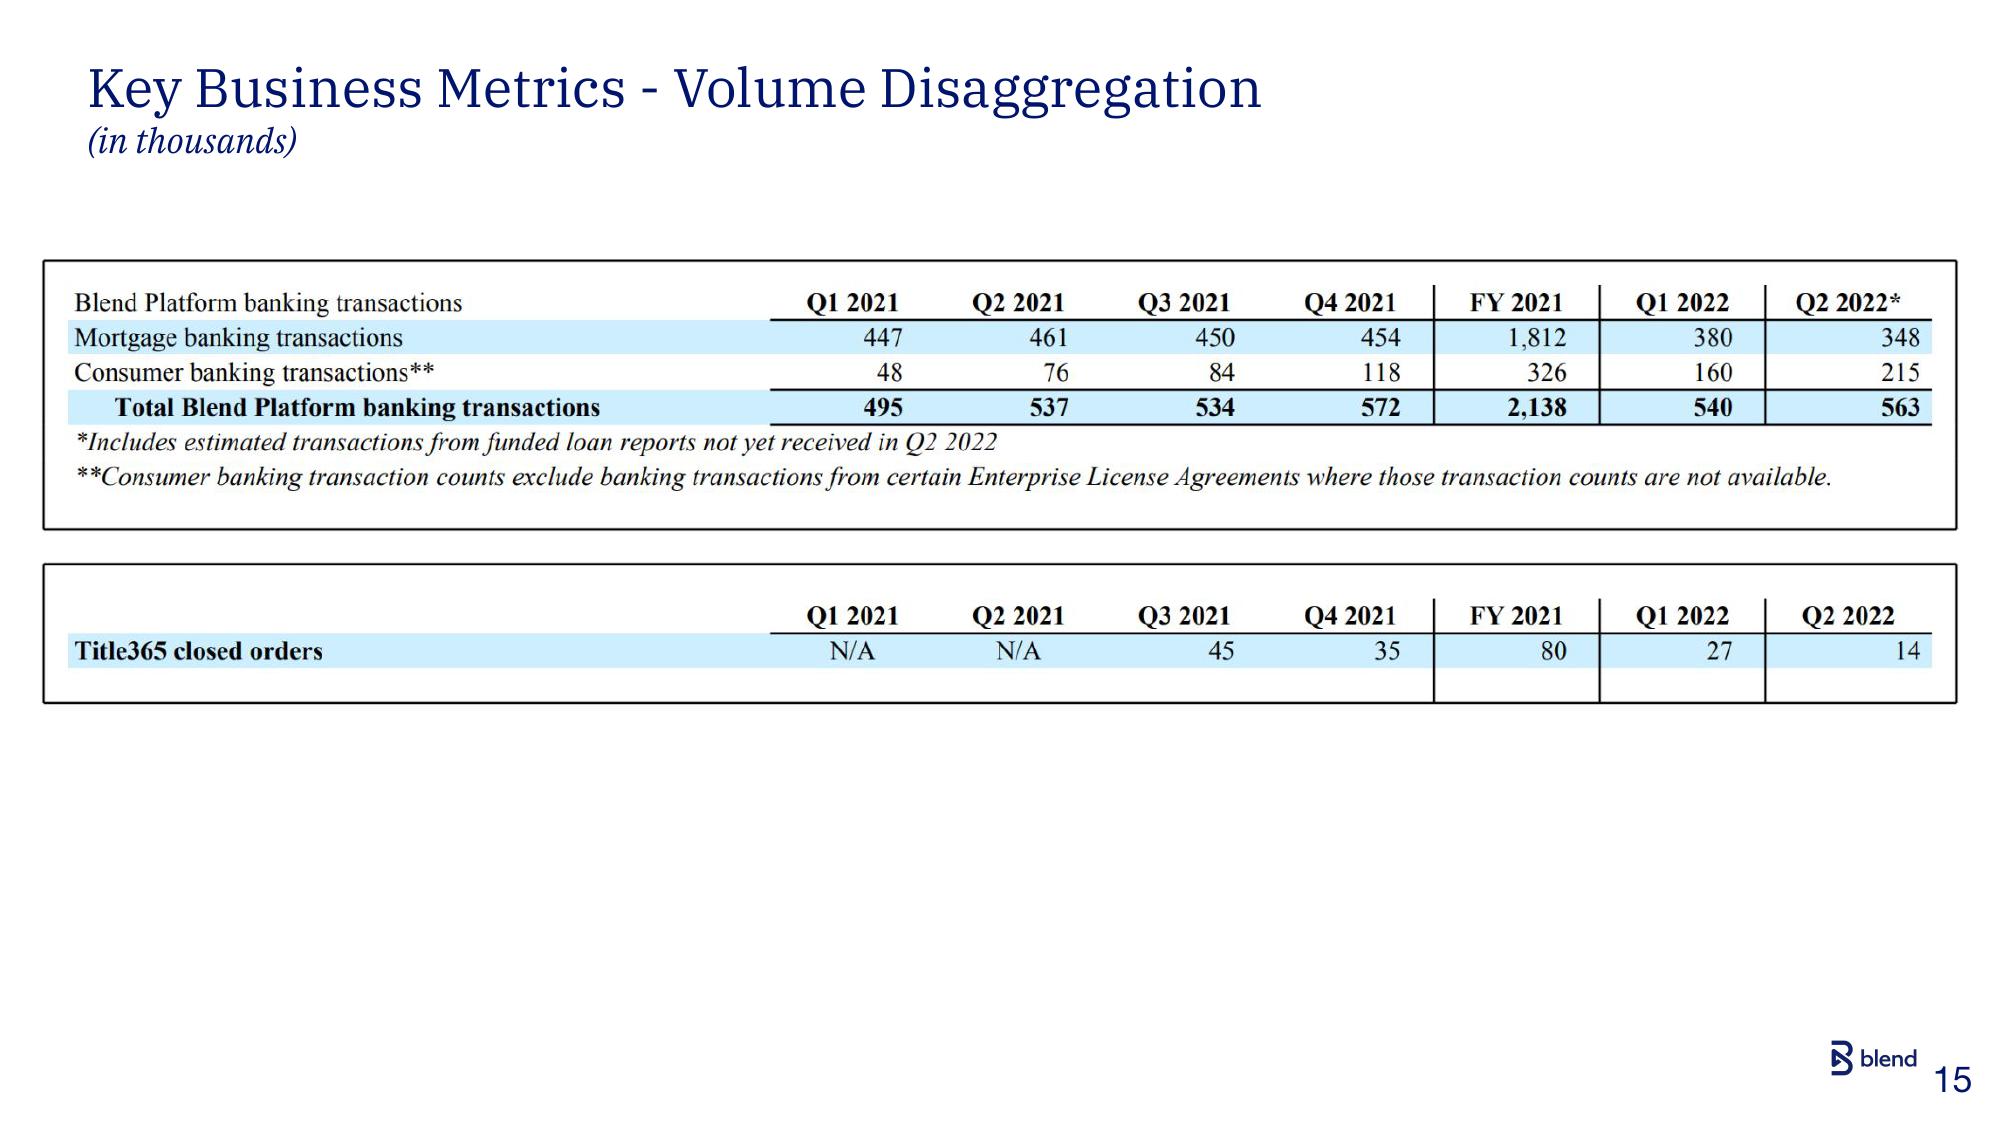
Key Business Metrics - Volume Disaggregation (in thousands) Q1 2021 447 48 Total Blend Platform banking transactions 495 *Includes estimated transactions from funded loan reports not yet received in Q2 2022 **Consumer banking transaction counts exclude banking transactions from certain Enterprise License Agreements where those transaction counts are not available. Blend Platform banking transactions Mortgage banking transactions Consumer banking transactions** Title365 closed orders Q1 2021 N/A Q2 2021 461 76 537 Q2 2021 N/A Q3 2021 450 84 534 Q3 2021 45 Q4 2021 454 118 572 Q4 2021 35 FY 2021 1,812 326 2,138 FY 2021 80 Q1 2022 380 160 540 Q1 2022 27 Q2 2022* 348 215 563 Q2 2022 14 blend 15
View entire presentation