Tudor, Pickering, Holt & Co Investment Banking
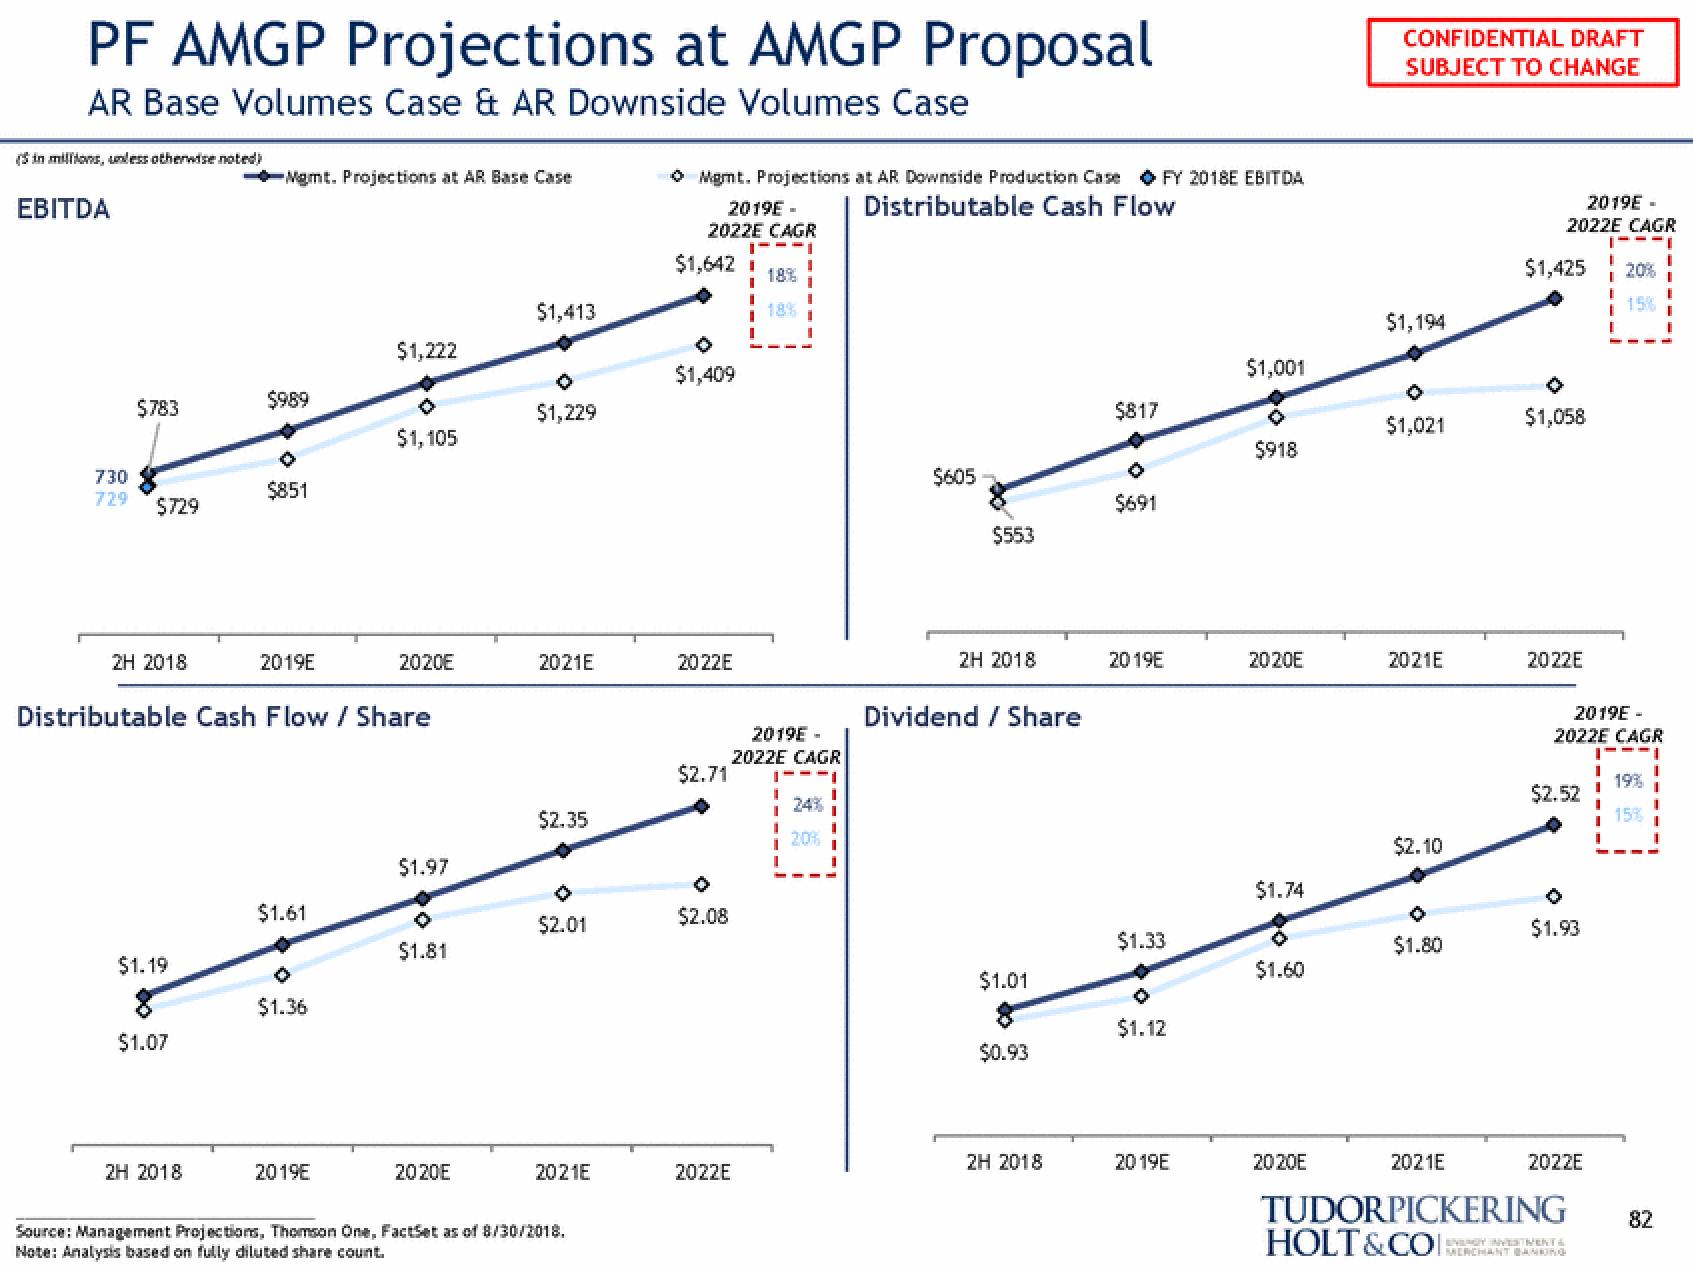
PF AMGP Projections at AMGP Proposal
AR Base Volumes Case & AR Downside Volumes Case
(in millions, unless otherwise noted)
EBITDA
$783
730
729 $729
2H 2018
$1.19
$1.07
Mgmt. Projections at AR Base Case
2H 2018
$989
$851
2019E
Distributable Cash Flow / Share
$1.61
0
$1.36
$1,222
2019E
$1,105
2020E
$1.97
$1.81
2020E
$1,413
$1,229
2021E
$2.35
$2.01
2021E
Source: Management Projections, Thomson One, FactSet as of 8/30/2018.
Note: Analysis based on fully diluted share count.
ⒸMgmt. Projections at AR Downside Production Case FY 2018E EBITDA
Distributable Cash Flow
2019E-
2022E CAGR
1---1
$1,642 i 18%
18%
$1,409
2022E
$2.71
O
$2.08
2022E
I
I
2019E-
2022E CAGR
24%
20%
$605
$553
2H 2018
Dividend / Share
$1.01
$0.93
2H 2018
$817
$691
2019E
$1.33
$1.12
2019E
$1,001
$918
2020E
$1.74
$1.60
CONFIDENTIAL DRAFT
SUBJECT TO CHANGE
2020E
$1,194
$1,021
2021E
$2.10
O
$1.80
2019E-
2022E CAGR
$1,425 20%
15%
$1,058
2022E
2019E-
2022E CAGR
|---|
19%
15%
$2.52
$1.93
1
2022E
1
I
2021E
TUDORPICKERING 82
HOLT&COCHANT BANKING
1View entire presentation