FaZe SPAC Presentation Deck
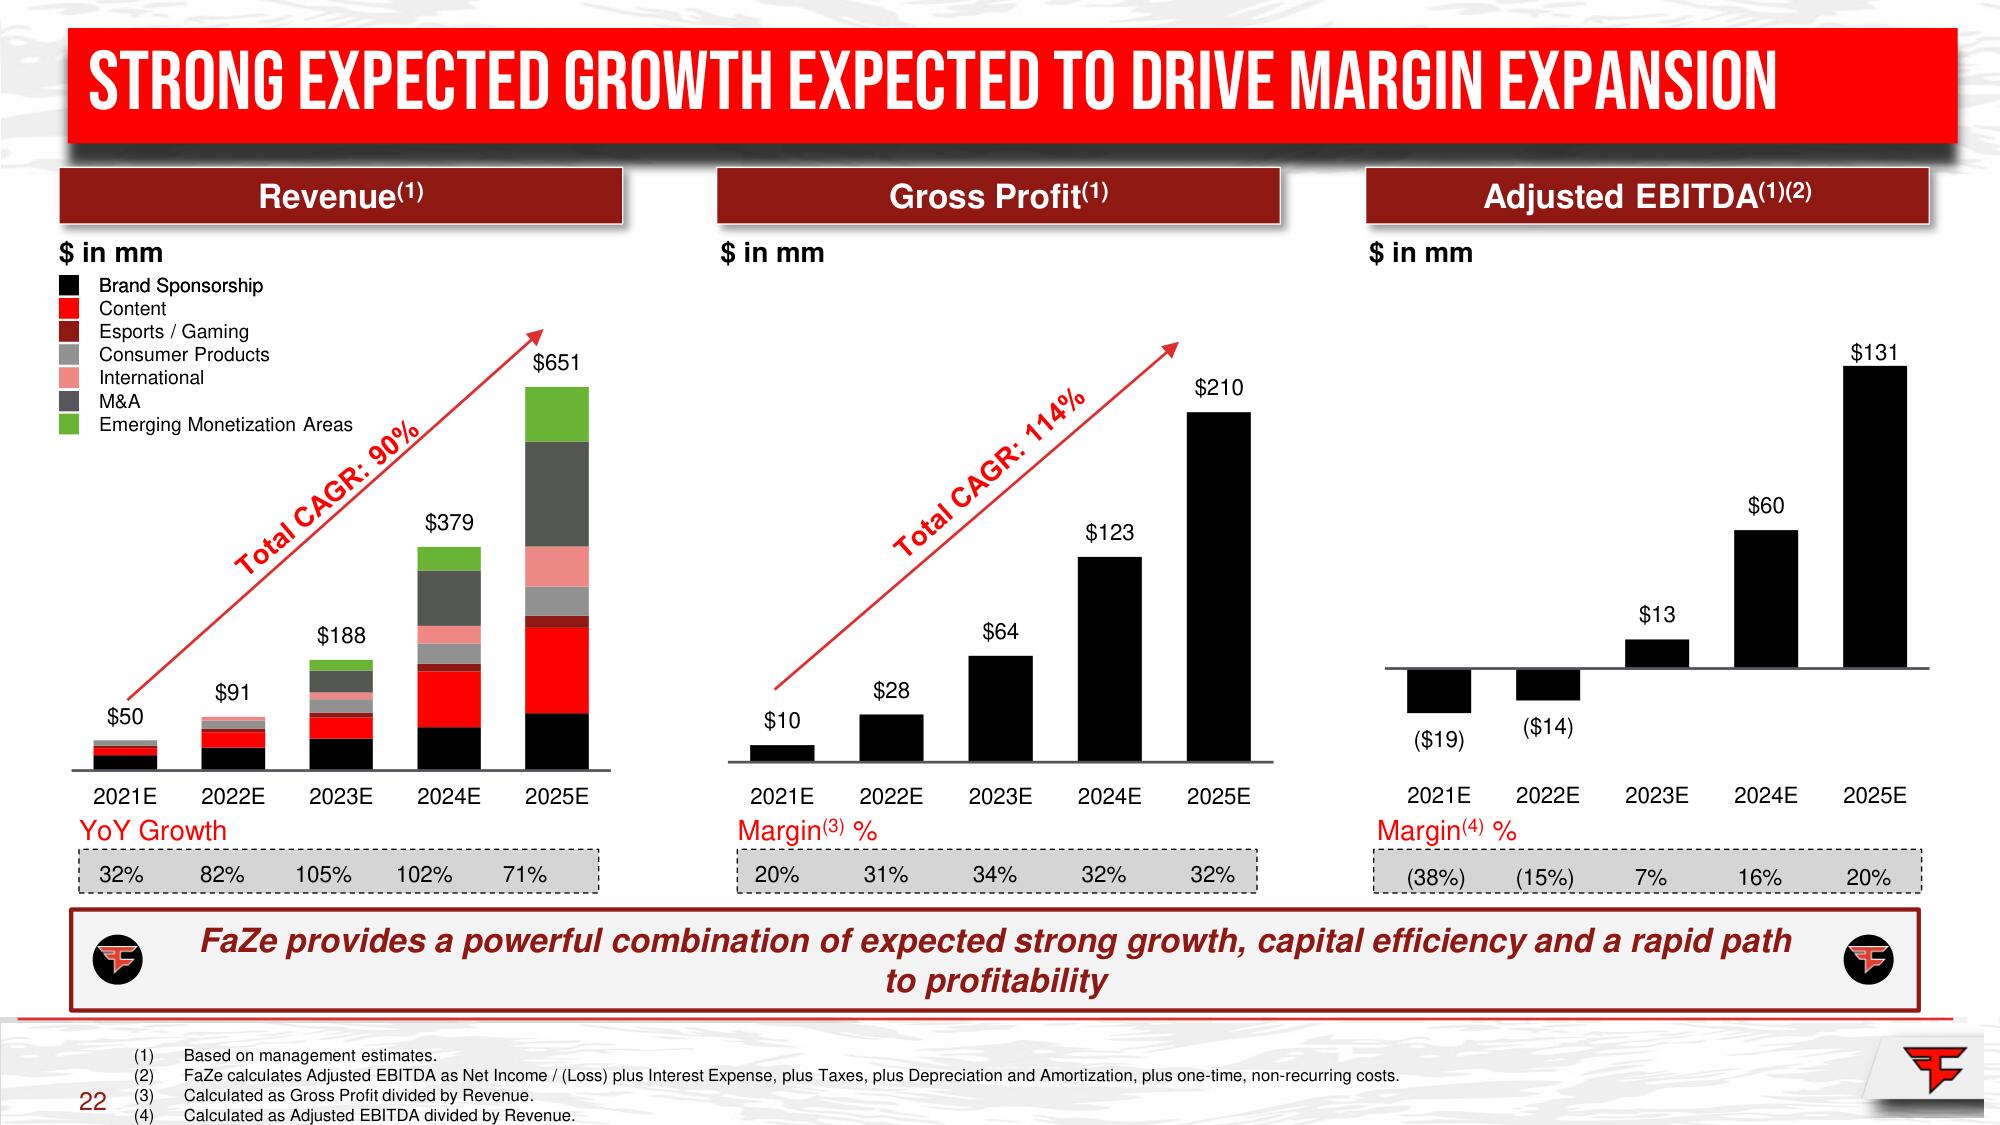
STRONG EXPECTED GROWTH EXPECTED TO DRIVE MARGIN EXPANSION
$ in mm
Brand Sponsorship
Content
Esports Gaming
Consumer Products
International
M&A
Emerging Monetization Areas
$50
32%
22
Revenue (1)
EN
$91
Total CAGR: 90%
2021E 2022E 2023E 2024E 2025E
YOY Growth
2%
$188
$379
105%
$651
2%
71%
$ in mm
$10
Gross Profit(1)
Total CAGR: 114%
$28
$64
$123
2021E 2022E 2023E 2024E
Margin(3) %
20%
319
34%
$210
2025E
32%
$ in mm
Adjusted EBITDA(1)(2)
($14)
($19)
2021E 2022E
Margin(4) %
(38%) (15%)
Based on management estimates.
FaZe calculates Adjusted EBITDA as Net Income / (Loss) plus Interest Expense, plus Taxes, plus Depreciation and Amortization, plus one-time, non-recurring costs.
(3) Calculated as Gross Profit divided by Revenue.
(4) Calculated as Adjusted EBITDA divided by Revenue.
$13
2023E
7%
$60
2024E 2025E
16%
FaZe provides a powerful combination of expected strong growth, capital efficiency and a rapid path
to profitability
$131
20%View entire presentation