Silicon Valley Bank Results Presentation Deck
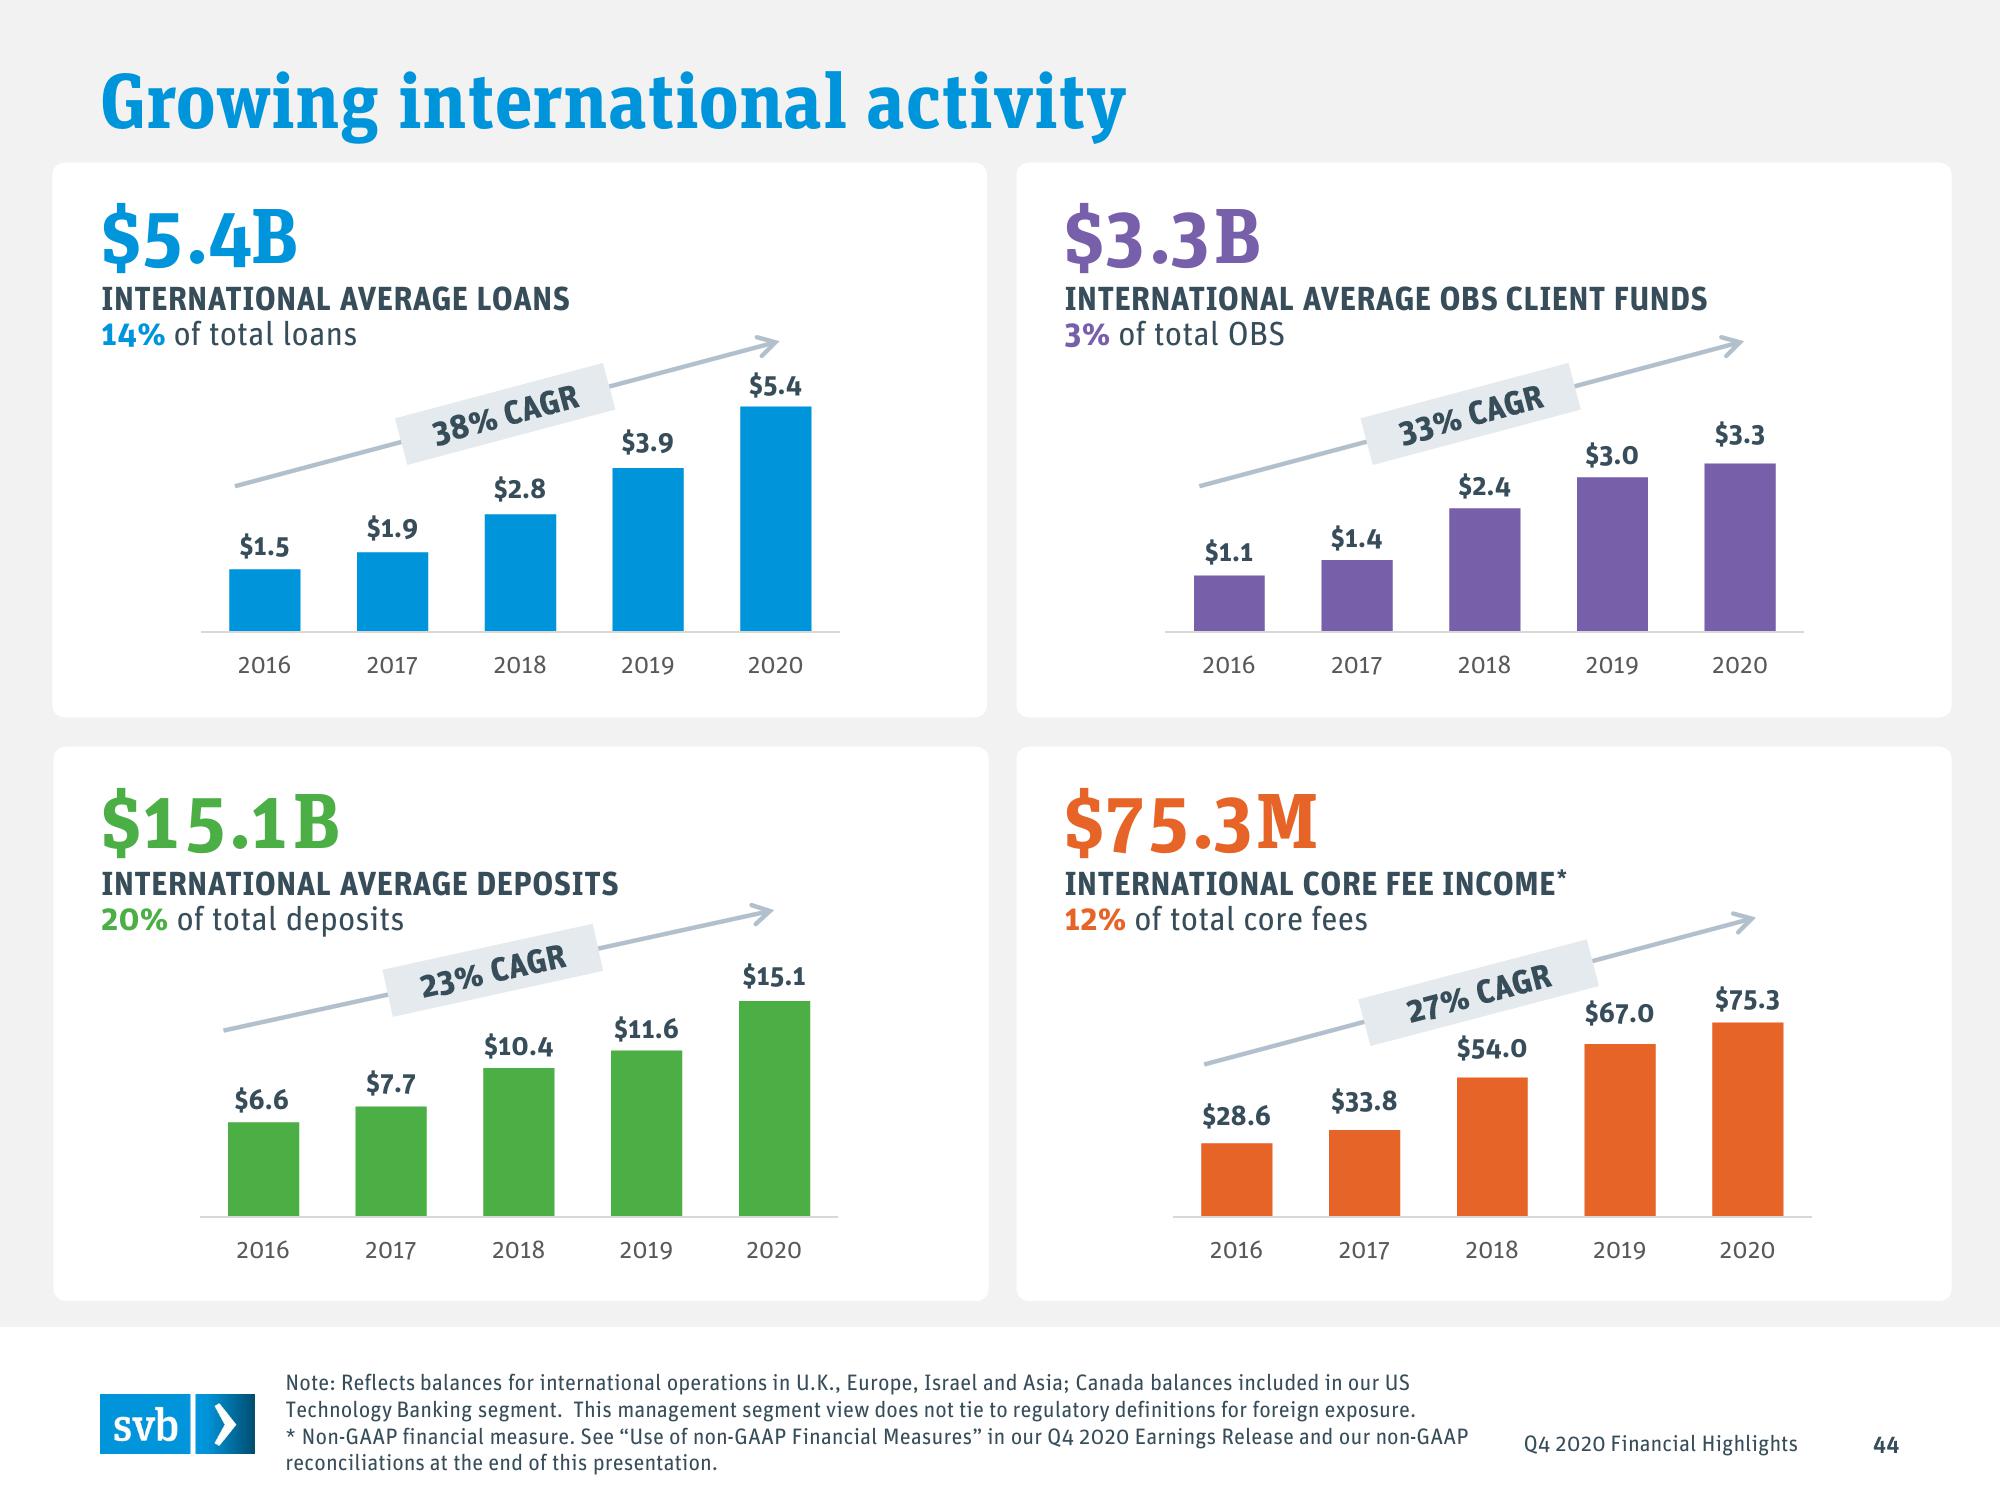
Growing international activity
$5.4B
INTERNATIONAL AVERAGE LOANS
14% of total loans
$1.5
2016
$6.6
2016
$1.9
svb >
2017
$15.1B
INTERNATIONAL AVERAGE DEPOSITS
20% of total deposits
38% CAGR
$7.7
2017
$2.8
2018
23% CAGR
$10.4
2018
$3.9
2019
$11.6
2019
$5.4
2020
$15.1
2020
$3.3B
INTERNATIONAL AVERAGE OBS CLIENT FUNDS
3% of total OBS
$1.1
2016
$28.6
$1.4
2016
2017
$75.3M
INTERNATIONAL CORE FEE INCOME*
12% of total core fees
$33.8
33% CAGR
2017
$2.4
2018
27% CAGR
$54.0
2018
Note: Reflects balances for international operations in U.K., Europe, Israel and Asia; Canada balances included in our US
Technology Banking segment. This management segment view does not tie to regulatory definitions for foreign exposure.
* Non-GAAP financial measure. See "Use of non-GAAP Financial Measures" in our Q4 2020 Earnings Release and our non-GAAP
reconciliations at the end of this presentation.
$3.0
2019
$67.0
2019
$3.3
2020
$75.3
2020
Q4 2020 Financial Highlights
44View entire presentation