Dave SPAC Presentation Deck
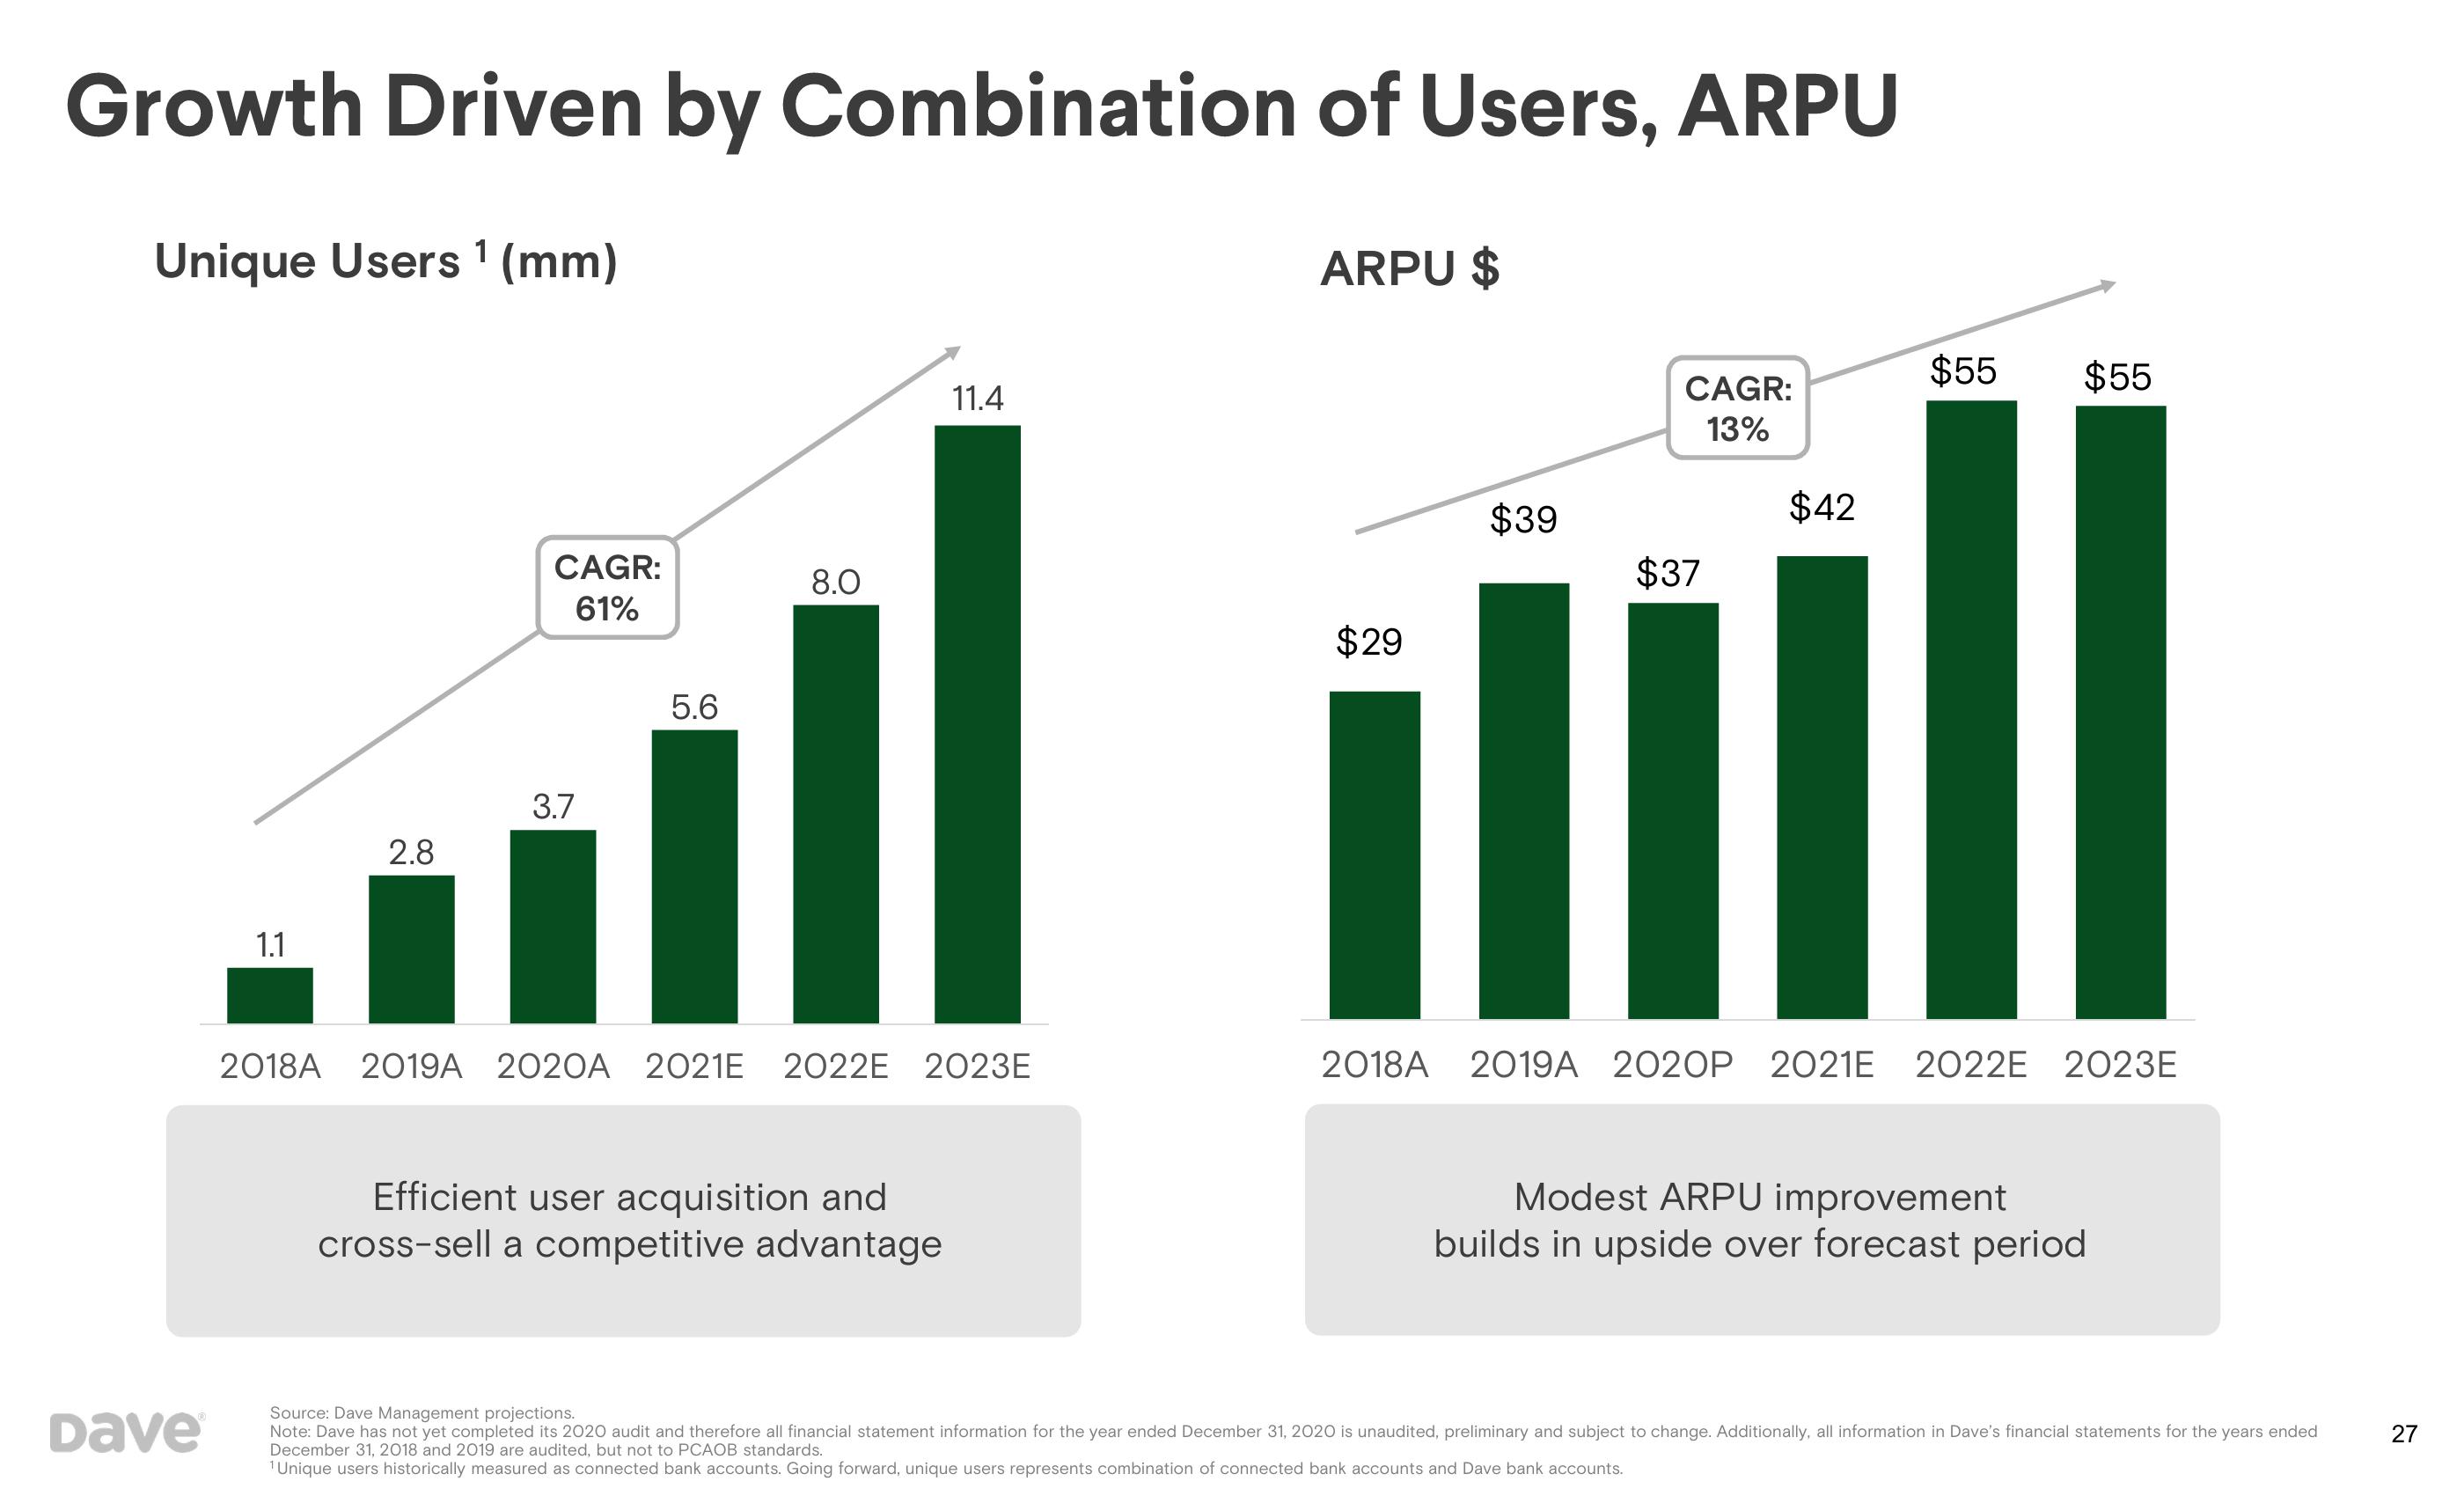
Growth Driven by Combination of Users, ARPU
Unique Users ¹ (mm)
Dave
1.1
CAGR:
61%
2.8
5.6
3.7
III
2018A 2019A 2020A 2021E 2022E 2023E
8.0
11.4
Efficient user acquisition and
cross-sell a competitive advantage
ARPU $
$29
$39
CAGR:
13%
$37
$42
$55
$55
2018A 2019A 2020P 2021E 2022E 2023E
Modest ARPU improvement
builds in upside over forecast period
Source: Dave Management projections.
Note: Dave has not yet completed its 2020 audit and therefore all financial statement information for the year ended December 31, 2020 is unaudited, preliminary and subject to change. Additionally, all information in Dave's financial statements for the years ended
December 31, 2018 and 2019 are audited, but not to PCAOB standards.
¹ Unique users historically measured as connected bank accounts. Going forward, unique users represents combination of connected bank accounts and Dave bank accounts.
27View entire presentation