Verint SPAC Presentation Deck
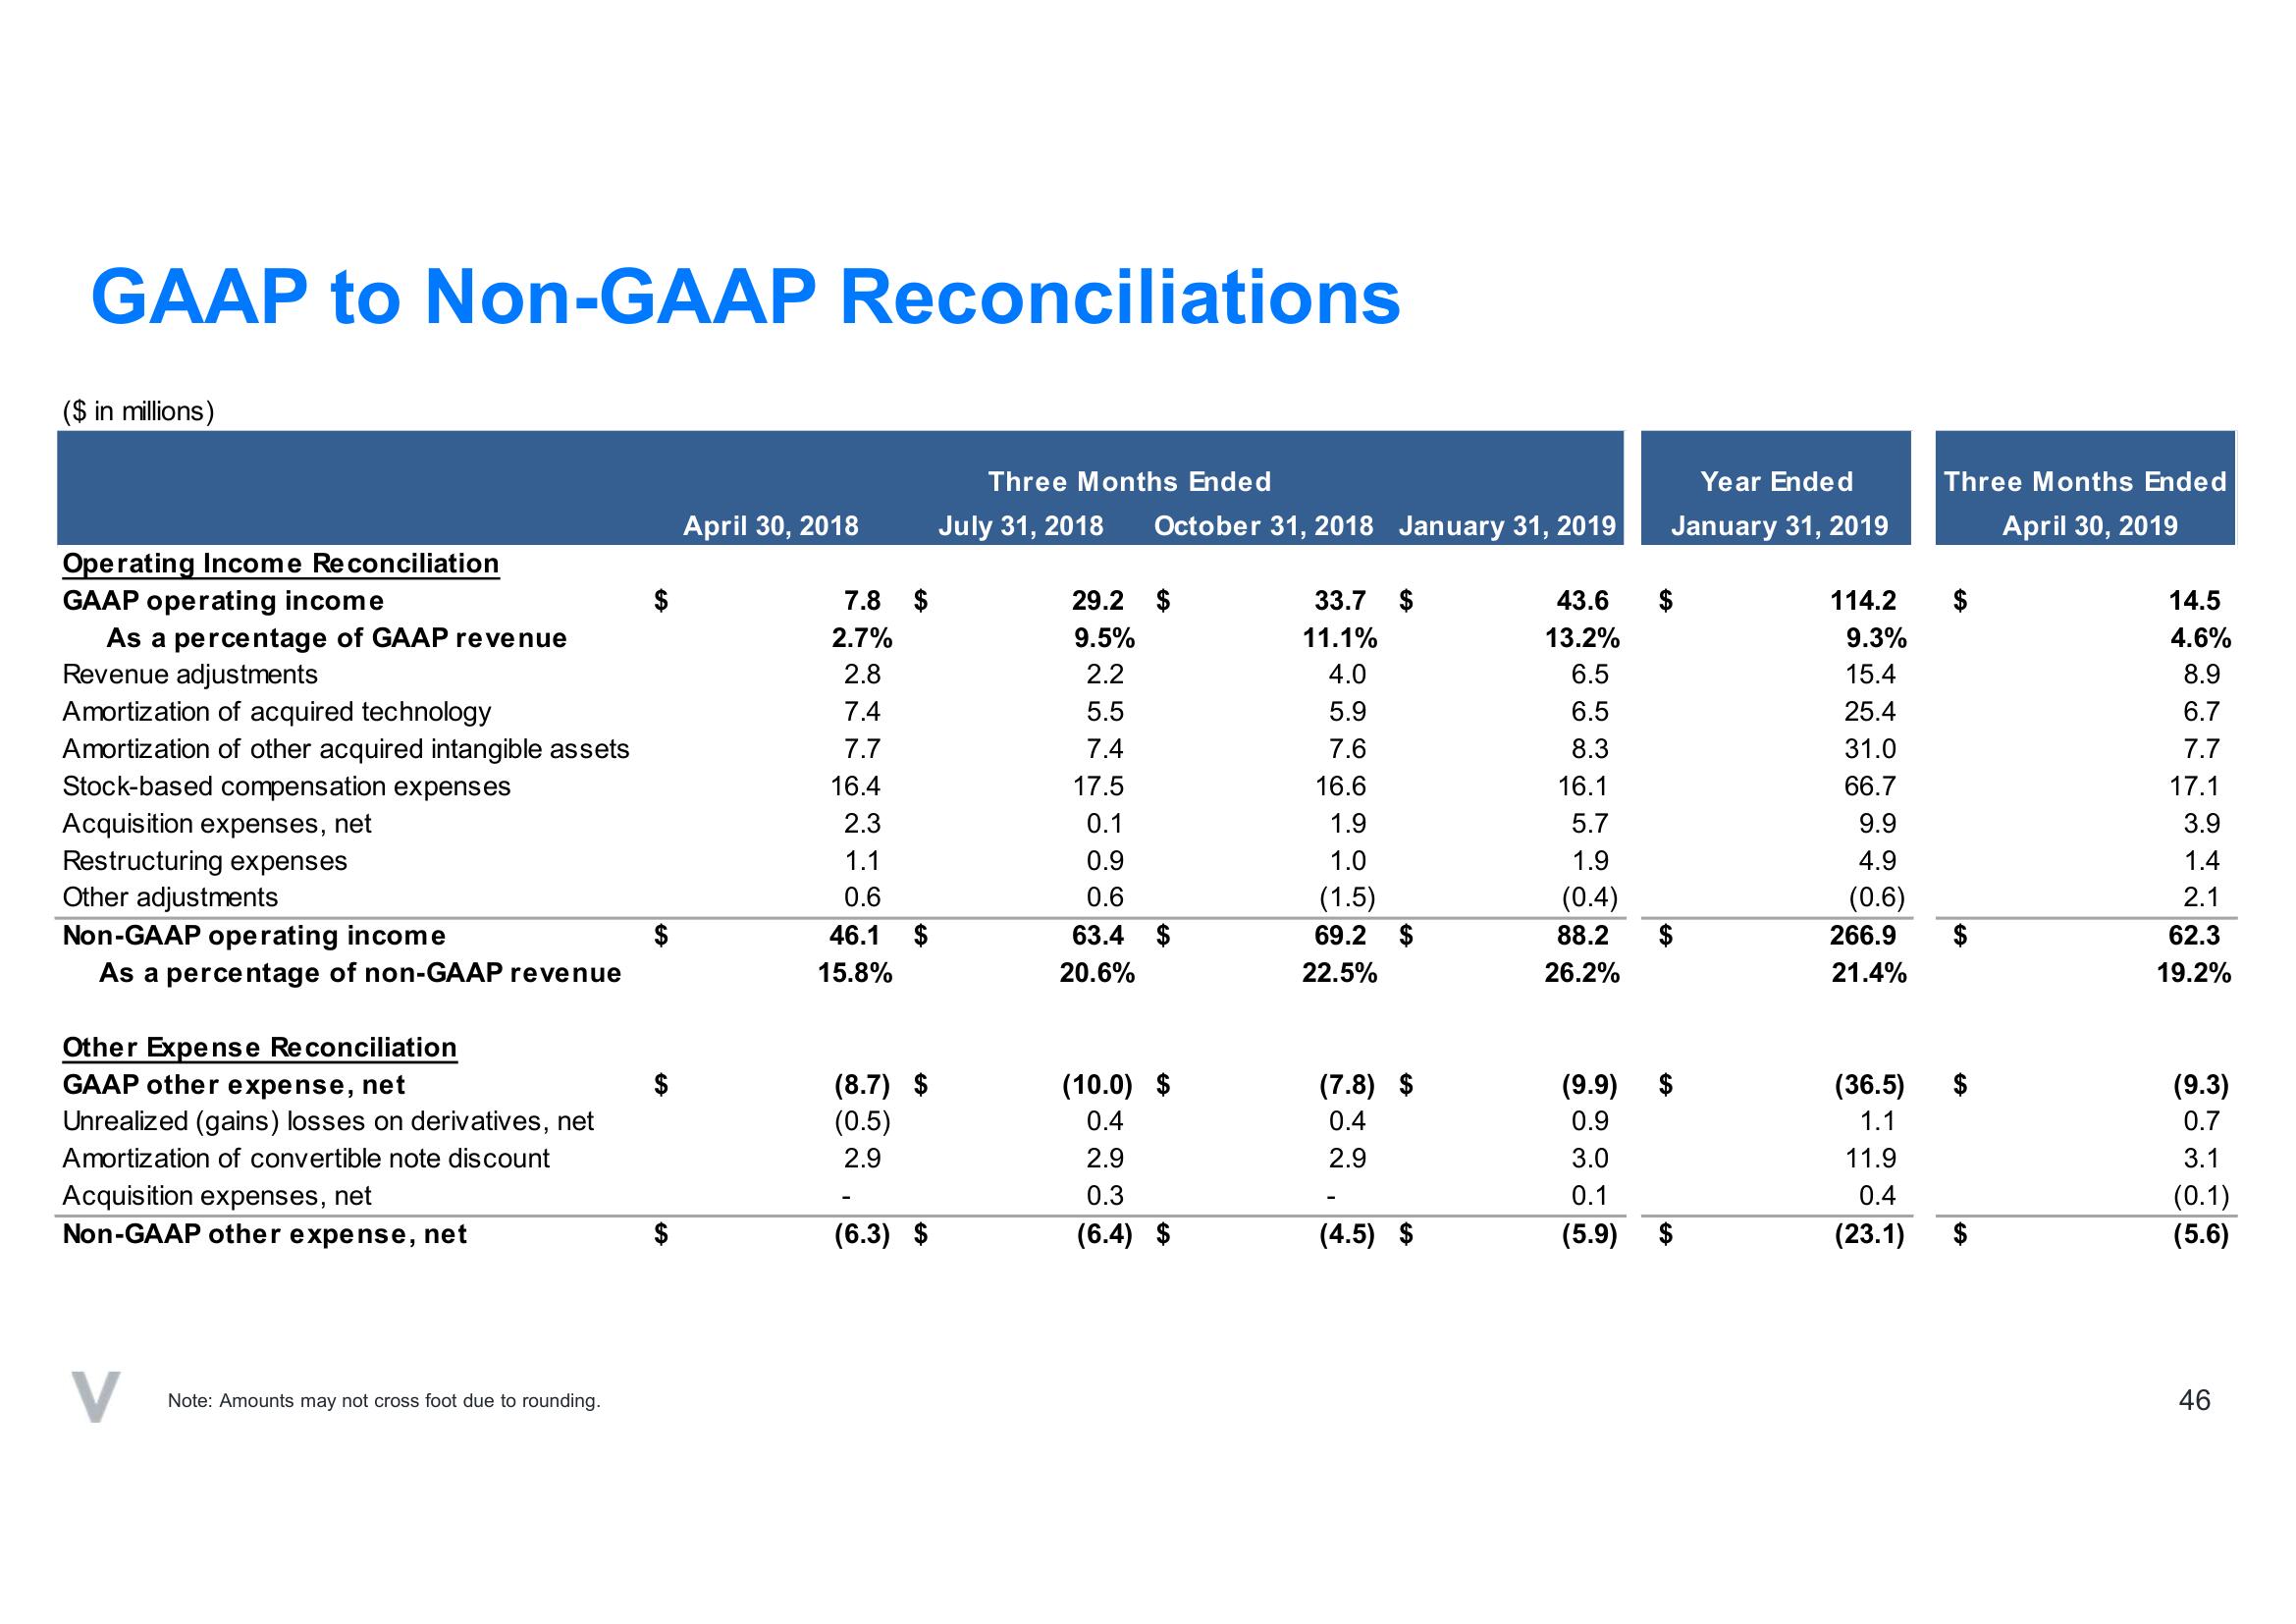
GAAP to Non-GAAP Reconciliations
($ in millions)
Operating Income Reconciliation
GAAP operating income
As a percentage of GAAP revenue
Revenue adjustments
Amortization of acquired technology
Amortization of other acquired intangible assets
Stock-based compensation expenses
Acquisition expenses, net
Restructuring expenses
Other adjustments
Non-GAAP operating income
As a percentage of non-GAAP revenue
Other Expense Reconciliation
GAAP other expense, net
Unrealized (gains) losses on derivatives, net
Amortization of convertible note discount
Acquisition expenses, net
Non-GAAP other expense, net
V
Note: Amounts may not cross foot due to rounding.
April 30, 2018
7.8 $
2.7%
2.8
7.4
7.7
16.4
2.3
1.1
0.6
46.1
15.8%
(8.7)
(0.5)
2.9
-
(6.3) $
Three Months Ended
July 31, 2018
October 31, 2018 January 31, 2019
29.2 $
9.5%
2.2
5.5
7.4
17.5
0.1
0.9
0.6
63.4 $
20.6%
(10.0)
0.4
2.9
0.3
(6.4) $
33.7 $
11.1%
4.0
5.9
7.6
16.6
1.9
1.0
(1.5)
69.2 $
22.5%
(7.8) $
0.4
2.9
(4.5) $
43.6
13.2%
6.5
6.5
8.3
16.1
5.7
1.9
(0.4)
88.2
26.2%
Year Ended
January 31, 2019
$
(9.9)
0.9
3.0
0.1
(5.9) $
114.2
9.3%
15.4
25.4
31.0
66.7
9.9
4.9
(0.6)
266.9
21.4%
(36.5)
1.1
11.9
0.4
(23.1)
Three Months Ended
April 30, 2019
14.5
4.6%
8.9
6.7
7.7
17.1
3.9
1.4
2.1
62.3
19.2%
(9.3)
0.7
3.1
(0.1)
(5.6)
46View entire presentation