AMC Investor Day Presentation Deck
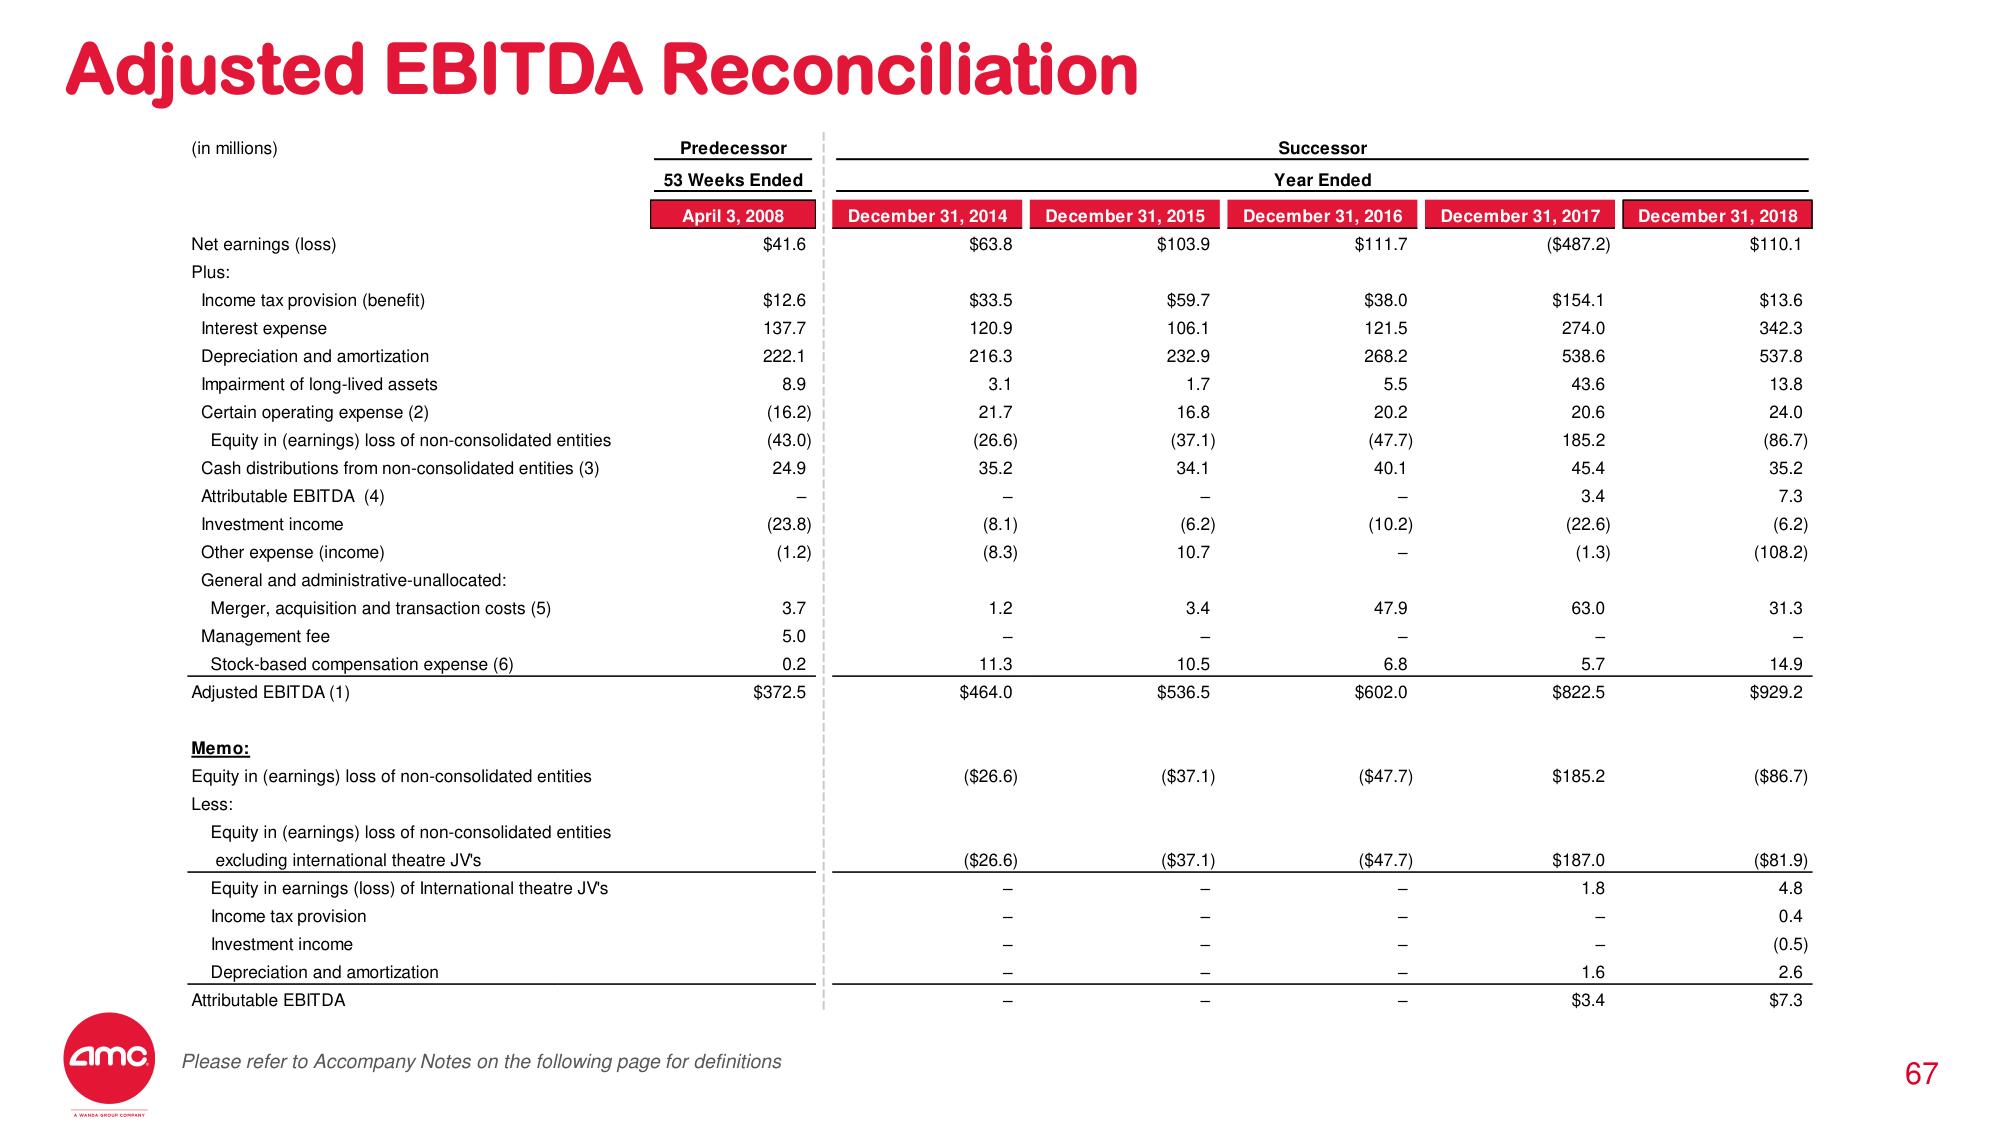
Adjusted EBITDA Reconciliation
amc
(in millions)
Net earnings (loss)
Plus:
Income tax provision (benefit)
Interest expense
Depreciation and amortization
Impairment of long-lived assets
Certain operating expense (2)
Equity in (earnings) loss of non-consolidated entities
Cash distributions from non-consolidated entities (3)
Attributable EBITDA (4)
Investment income
Other expense (income)
General and administrative-unallocated:
Merger, acquisition and transaction costs (5)
Management fee
Stock-based compensation expense (6)
Adjusted EBITDA (1)
Memo:
Equity in (earnings) loss of non-consolidated entities
Less:
Equity in (earnings) loss of non-consolidated entities.
excluding international theatre JV's
Equity in earnings (loss) of International theatre JV's
Income tax provision
Investment income
Depreciation and amortization
Attributable EBITDA
Predecessor
53 Weeks Ended
April 3, 2008
$41.6
$12.6
137.7
222.1
8.9
(16.2)
(43.0)
24.9
(23.8)
(1.2)
3.7
5.0
0.2
$372.5
Please refer to Accompany Notes on the following page for definitions
December 31, 2014
$63.8
$33.5
120.9
216.3
3.1
21.7
(26.6)
35.2
(8.1)
(8.3)
1.2
11.3
$464.0
($26.6)
($26.6)
December 31, 2015
$103.9
$59.7
106.1
232.9
1.7
16.8
(37.1)
34.1
(6.2)
10.7
3.4
10.5
$536.5
($37.1)
($37.1)
Successor
Year Ended
December 31, 2016
$111.7
$38.0
121.5
268.2
5.5
20.2
(47.7)
40.1
(10.2)
47.9
6.8
$602.0
($47.7)
($47.7)
December 31, 2017
($487.2)
$154.1
274.0
538.6
43.6
20.6
185.2
45.4
3.4
(22.6)
(1.3)
63.0
5.7
$822.5
$185.2
$187.0
1.8
1.6
$3.4
December 31, 2018
$110.1
$13.6
342.3
537.8
13.8
24.0
(86.7)
35.2
7.3
(6.2)
(108.2)
31.3
14.9
$929.2
($86.7)
($81.9)
4.8
0.4
(0.5)
2.6
$7.3
67View entire presentation